Our study included suspected patients and we made comparisons between confirmed and non-confirmed patients.
•
The CT imaging features of COVID-19 show similar manifestations with common viral pneumonias while it still has specific imaging characteristics.
•
The combinations of GGO improved the specific of diagnosis which could be useful in the differential diagnosis of COVID-19.
Abstract
Objective
The purpose of this study was to distinguish the imaging features of COVID-19 from those of other infectious pulmonary diseases and evaluate the diagnostic value of chest CT for suspected COVID-19 patients.
Methods
Adult patients suspected of COVID-19 aged >18 years who underwent chest CT scans and reverse-transcription polymerase chain reaction (RT-PCR) tests within 14 days of symptom onset were enrolled. The enrolled patients were confirmed and grouped according to the results of the RT-PCR tests. The basic demographics, single chest CT features, and combined chest CT features were analyzed for the confirmed and nonconfirmed groups.
Results
A total of 130 patients were enrolled, with 54 testing positive and 76 testing negative. The typical CT imaging features of the positive group were ground glass opacities (GGOs), the crazy-paving pattern and air bronchogram. The lesions were mostly distributed bilaterally and close to the lower lungs or the pleura. When features were combined, GGOs with bilateral pulmonary distribution and GGOs with pleural distribution were more common among the positive patients, found in 31 (57.4%) and 30 patients (55.6%), respectively. The combinations were almost all statistically significant (P < .05), except for the combination of GGOs with consolidation. Most combinations presented relatively low sensitivity but extremely high specificity. The average specificity of these combinations was approximately 90%.
Conclusions
The combinations with GGOs could be useful in the identification and differential diagnosis of COVID-19, alerting clinicians to isolate patients for prompt treatment and repeat RT-PCR tests until the end of incubation.
]. The virus causing the epidemic was detected as a new coronavirus (2019-nCoV), and the resulting pneumonia was then named by the WHO as Coronavirus Disease 2019 (COVID-19) [
]. As of March 17, 2020, a total of 81,118 patients in China have been diagnosed with confirmed COVID-19, and 68,802 patients were cured and discharged [
]. At the same time, the number of suspected cases has also decreased significantly. This shows that China's epidemic prevention policy has achieved initial results. However, the infection has spread to over 48 countries worldwide, especially in Iran, Korea and some European countries, even affecting the United States. The global risk of this epidemic was escalated to the highest level by the WHO on February 28. Fast and effective diagnostic methods for this disease are of great importance at present.
According to the latest Diagnosis and Treatment Program for COVID-19 of China [
], the diagnosis of COVID-19 requires a reverse-transcription polymerase chain reaction (RT-PCR) test, but a certain rate of false negative results has been reported [
]. Its limited production and relatively long testing period might not be conducive for screening. Accumulated clinical experience suggests that early chest computed tomography might be helpful in the differential diagnosis of suspected cases. Recently, Chung, Fang and Kanne, etc. reported the chest CT imaging features of COVID-19 [
]. However, there is no agreed standard for how to confirm a diagnosis of COVID-19 with these features. We retrospectively collected chest CT images of suspected pneumonia patients, divided them according to the results of RT-PCR tests into positive and negative groups and then compared the differences in CT features between the two groups. Our goal is to use statistical methods to distinguish the imaging features of COVID-19 from other infectious pulmonary diseases and evaluate the diagnostic value of chest CT for suspected COVID-19 patients.
2. Materials and methods
2.1 Patient population
The data used in this multicenter retrospective study were collected from three tertiary hospitals of two provinces in China. We enrolled a consecutive sample of suspected COVID-19 patients from January 12, 2020 to February 13, 2020 according to the following inclusion criteria: (1) suspicion of COVID-19 according to the 6th edition of the Diagnosis and Treatment Program for COVID-19 of China [
]; (2) age over 18 years; and (3) <14 days from onset to first CT. Exclusion criteria included (1) past history of chronic lung disease and (2) pregnancy. Finally, 130 patients participated in our research. These patients' general information, epidemiological history and CT imaging data were retrospectively collected.
2.2 Study design
The diagnostic criteria for suspected cases are as defined in the 6th edition of the Diagnosis and Treatment Program for COVID-19 of China [
]. Nasopharyngeal swabs or sputum specimens were collected for running RT-PCR tests. Patients with first negative results received repeated tests after an interval of at least 1 day. All suspected cases were divided into positive and negative groups according to the results of the RT-PCR test. Patients who were negative before but positive on retests were eventually defined as positive.
All patients were prepared for CT scan examination; 33 patients were scanned on an Optima 670 CT scanner, GE, 41 patients were scanned on Revolution Frontier, GE, and 56 patients were scanned on a SOMATOM Definition Flash, Japan. Examinations followed the normal chest protocols. The overall scan time was 2 s, and the slice thickness for reconstruction was 1.25 mm. All the reports were issued after double-blind reviews by two radiologists and were resolved by a chief radiologist when opinions diverged.
This study was approved by the Ethics of Committees of the local hospital. Informed consent for this retrospective study was waived.
2.3 Qualitative image analysis
According to the newly reported CT imaging features of COVID-19 and previous studies on the disease [
], we summarized the features that may appear on early chest CT. Lesion morphology was described as the presence of (1) a ground-glass opacities (GGOs); (2) consolidation; (3) crazy-paving pattern; (4) air bronchogram; (5) cavitation; (6) pulmonary nodule; (7) lymphadenopathy; (8) pleural effusion; (9) pulmonary atelectasis; or (10) pleural thickening. Lesion distribution, such as whether they were unilateral, bilateral or peripleural, the number of lung lobes involved and the involvement of the upper, middle, and lower fields of the lung were also counted.
2.4 Statistical analysis
Patient data were recorded by Epidata, and statistical analysis was performed using SPSS 13.0 (IBM Corporation). Normally distributed continuous variables are expressed as the mean ± SD (), and variables with a skewed distribution were presented as the medians (interquartile ranges). Independent t-tests were used to compare measurement data, and Mann-Whitney U tests were used for data with skewed distributions. Categorical information is described by percentages and was compared using the chi-squared test or Fisher's exact test. All statistical tests were bidirectional comparisons, and P < .05 was regarded as statistically significant.
3. Results
3.1 Comparisons of basic demographics
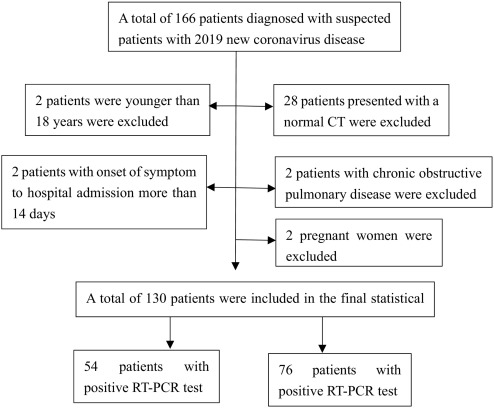
A total of 166 patients were enrolled in this study. Excluding 2 patients younger than 18 years old, 28 patients with normal CT presentations, 2 patients with underlying lung disease, 2 patients with onset to consultation over 14 days, and 2 patients who could not undergo chest CT because of pregnancy, 130 patients were finally included in the statistical analysis, with 54 testing positive and 76 testing negative for COVID-19 (see Fig. 1). As shown in Table 1, the mean age of the positive group patients was 45.1 ± 13.4 years, ranging from 19 to 77 years, and 28 of the patients were males (51.9%). The average time from symptom onset to the first visit was 4 days. For the negative group patients, the average age was 41.8 ± 13.6 years, ranging from 19 to 81 years, and 49 of the patients were males (64.5%). The average time from the onset of symptoms to the first visit was 3 days. The proportion of patients with a history of Wuhan residence and the clustering incidence between the two groups were statistically significant (P < .05), while the remaining variables were not significant (Fig. 2).
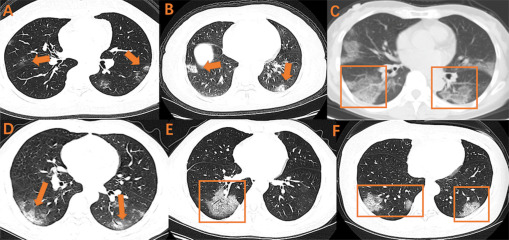
Various combinations of GGO on early CT imaging were shown as above. A, B, C: GGO with bilateral and subpleural distribution; D: GGO with air bronchogram and bilateral lower pulmonary distribution; E: GGO with air bronchogram; F: GGO with crazy-paving pattern and bilateral lower pulmonary distribution.
The characteristics of the lesion morphologies are shown in Table 2. The positive group patients in the early stage mostly had GGOs (38, 70.4%), a typical imaging manifestation in viral pneumonia, followed by the crazy-paving pattern (16, 29.6%), air bronchogram (14, 25.9%), consolidation (12, 22.2%) and pleural thickening (11, 20.4%). Pulmonary nodules, pleural effusion, lymphadenopathy and pulmonary atelectasis were rare. The presence of GGOs, the crazy-paving pattern, air bronchogram, and pleural thickening was significantly different between the two groups (P < .05). The remaining variables were not (P > .05).
The lesion distribution characteristics are shown in Table 3. For the positive group, lesions in the early stage were mainly distributed bilaterally (40, 74.1%) and near the pleura (33, 61.1%). The involvement of two lobes and all lobes were most common, seen in 18 (33.3%) and 13 patients (24.1%), respectively. Forty-five patients (83.3%) showed involvement of at least two lobes. Left lower lobe (40, 74.1%) and right lower lobe (43, 79.6%) involvement were also frequently observed. Peripheral, bilateral or lower lung distribution and multilobe involvement was significantly different between the two groups (P < .05), and the remaining variables were not significant (P > .05).
3.3 Comparisons of combined early CT imaging features
According to the statistical results in Table 2, Table 3, we found that GGOs were the basic manifestation in the positive group. To increase distinguishability on imaging, we combined GGOs with other statistically significant features. Table 4 shows the various combinations of imaging features on early CT. When two features were combined, the combination of GGOs with bilateral pulmonary distribution and the combination of GGOs with pleural distribution were the most common, found in 31 (57.4%) and 30 patients (55.6%), respectively. When three items were combined, 26 patients (48.1%) presented with GGOs and bilateral pulmonary and peripleural distributions. When four items were combined, the combination of GGOs, a bilateral pulmonary distribution, the crazy-paving pattern, and pleural distribution was the most common, seen 12 patients (22.2%). The presence of almost all these combinations was significantly different between the two groups (P < .05), except for the combination of GGOs with consolidation.
Table 4Combined CT imaging features between positive group and negative group.
Combined features
Positive group
Negative group
P
n = 54
n = 76
GGO + Consolidation
11(20.4%)
8(10.5%)
0.12
GGO+ Crazy-paving pattern
16(29.6%)
3(3.9%)
<0.01
GGO + Air bronchogram
14(15.9%)
4(5.3%)
<0.01
GGO + Bilateral pulmonary distribution
31(57.4%)
15(19.7%)
<0.01
GGO + Bilateral lower pulmonary distribution
21(38.9%)
8(10.5%)
<0.01
GGO + Peripleural distribution
30(55.6%)
16(21.1%)
<0.01
GGO + Bilateral lower pulmonary distribution+Peripleural distribution
17(31.5%)
5(6.6%)
<0.01
GGO + Bilateral pulmonary distribution+Peripleural distribution
26(48.1%)
8(10.5%)
<0.01
GGO + Crazy-paving pattern+Peripleural distribution
12(22.2%)
3(3.9%)
<0.01
GGO + Air bronchogram +Peripleural distribution
11(20.4%)
2(2.6%)
<0.01
GGO + Crazy-paving pattern+Bilateral lower pulmonary distribution
11(20.4%)
1(1.3%)
<0.01
GGO + Air bronchogram+Bilateral lower pulmonary distribution
8(14.8%)
1(1.3%)
<0.01
GGO + Bilateral pulmonary distribution+Crazy-paving Pattern+ Pleural distribution
12(22.2%)
2(2.6%)
<0.01
GGO + bilateral pulmonary distribution+Air bronchogram+ Peripleural distribution
10(18.5%)
1(1.3%)
<0.01
GGO + Bilateral lower pulmonary distribution+Crazy-paving pattern+Peripleural distribution
9(16.7%)
1(1.3%)
<0.01
GGO + Bilateral lower pulmonary distribution+Air bronchogram +Peripleural distribution
3.4 Comparisons of the diagnostic value of combined imaging features between the positive and negative groups
As shown in Table 5, GGOs with bilateral pulmonary distribution and GGOs with peripleural distribution both presented the highest sensitivity of 57%, followed by GGOs combined with bilateral pulmonary distribution and peripleural distribution at 48%. The remaining combinations had sensitivities of approximately 25%. In contrast, these combinations presented with much better specificity. When combining two items, the specificity of GGOs with the crazy-paving pattern was up to 96%, followed by GGOs with air bronchogram (95%). When three features were combined, the specificity was over 95%, and GGOs with the crazy-paving pattern and bilateral pulmonary distribution had the highest at 99%. The specificity of diagnosis was almost 99% for four items.
Table 5The diagnostic value of combined CT imaging features between positive group and negative group.
Combined features
Sensitivity
Specificity
GGO+ Crazy-paving pattern
0.30
0.96
GGO + Air bronchogram
0.26
0.95
GGO + Bilateral pulmonary distribution
0.57
0.81
GGO + Bilateral lower pulmonary distribution
0.39
0.89
GGO + Peripleural distribution
0.57
0.79
GGO + Bilateral lower pulmonary distribution+Peripleural distribution
0.31
0.93
GGO + Bilateral pulmonary distribution+Peripleural distribution
0.48
0.89
GGO + Crazy-paving pattern+Peripleural distribution
0.22
0.96
GGO + Air bronchogram +Peripleural distribution
0.20
0.97
GGO + Crazy-paving pattern+Bilateral lower pulmonary distribution
0.20
0.99
GGO + Air bronchogram+Bilateral lower pulmonary distribution
0.15
0.99
GGO + Bilateral pulmonary distribution+Crazy-paving Pattern+ Peripleural distribution
0.22
0.97
GGO + bilateral pulmonary distribution+Air bronchogram+ Peripleural distribution
0.19
0.99
GGO + Bilateral lower pulmonary distribution+Crazy-paving pattern+Peripleural distribution
0.17
0.99
GGO + Bilateral lower pulmonary distribution+Air bronchogram +Peripleural distribution
In the positive group, our study showed that GGOs are the basic manifestation in CT imaging of COVID-19, followed by consolidation, the crazy-paving pattern and air bronchogram. Lesions were mainly distributed bilaterally, close to the lower lungs or the pleura. These findings are similar to those in previous descriptive studies on COVID-19 [
] and also overlap with the imaging features of other viral pneumonias. For this reason, we estimated the pathological mechanism of COVID-19 involves transmission though the respiratory tract and damage to the terminal bronchioles and lung parenchyma near the bronchioles in the early stages, which in turn affect the entirety of the lung lobules and results in diffuse alveolar damage, similar to other viral pneumonias [
]. Apparently, the imaging features of COVID-19 greatly resemble those of SARS (severe acute respiratory syndrome) and MERS (Middle East respiratory syndrome), which are other members of the coronavirus family [
However, some distinguishable imaging features can be seen for COVID-19. The CT imaging features of SARS are mainly manifested by GGOs with consolidation [
]. Lower lung distribution and peripheral involvement are more common, and there is more unifocal involvement than multifocal and bilateral involvement. The manifestations of MERS on chest CT are mainly subpleural distributions, accompanied by extensive GGOs and consolidations [
]. In addition, influenza virus pneumonia has a high frequency of occurrence in winter and spring, with manifestations of cavities, GGOs and a lobular distribution on chest CT [
Furthermore, we found that GGOs, the crazy-paving pattern, air bronchogram, and pleural thickening were more common in patients with COVID-19 than in patients with other viral pneumonias on chest CT imaging. Peripheral, bilateral or lower lung distribution and multilobe involvement also presented more frequently in COVID-19 patients. This may help us identify COVID-19 patients with chest CT scans. Previous studies have to date merely described the dynamic changes in the chest CT imaging of COVID-19 and presented the features currently used in the diagnosis of the disease [
]. Some of them focused on the sensitivity compared to that of RT-PCR with a relatively small sample size, but they did not compare these features with those of other viral pneumonias or explain how a differential diagnosis could be made by chest CT [
]. Our study includes all suspected cases, including positive and negative cases, which may be more useful for early differential diagnosis.
Theoretically, a definite diagnosis cannot be achieved on the basis of one single imaging feature, as it may overlap with individual imaging features from other viral pneumonias as mentioned above. Therefore, we combined several statistically significant imaging features to evaluate the diagnostic value of chest CT scans. Apparently, the combination of features resulted in relatively low sensitivity but extremely high specificity. The average specificity of all combinations was approximately 90%, and the combination of GGOs with the crazy-paving pattern and bilateral pulmonary distribution showed the highest specificity at 99% when three items were combined. The use of a four-item combination also resulted in 99% specificity. In conclusion, the combinations of GGO with different features from chest CT might significantly increase the specificity in the diagnosis of COVID-19. This means that in a series presenting crazy-paving patterns, air bronchograms, bilateral lower pulmonary distributions, bilateral pulmonary distributions and pleural distributions, as long as they appear simultaneously with GGOs on chest CT, COVID-19 should be highly suspected, even if the patient has repeated negative RT-PCR outcomes. This might help emergency physicians identify COVID-19 patients faster and more effectively. Based on accumulated experience, we recommend that these patients be quarantined and have their RT-PCR tests repeated until the average incubation ends, especially in areas with severe outbreaks. Epidemiological exposure, RT-PCR tests and chest CT scans are equally critical to diagnosis.
There are several limitations in our study. First, the goal was to compare the difference in CT imaging features between confirmed and nonconfirmed COVID-19 patients. Some early lesions might not be visible on chest CT since the maximum incubation period is 14 days or even more [
]. Therefore, the expression of time may not be precise enough according to the development of this disease. Second, the current gold standard for the diagnosis of COVID-19 is merely the RT-PCR test [
]. Since the test samples are mostly pharynx swabs rather than bronchoalveolar lavage fluid (BALF) samples, false negative results might still be present after repeat testing.
In summary, the manifestations of COVID-19 vary. Some patients show similar manifestations with those of common viral pneumonias. However, COVID-19 still demonstrates specific imaging characteristics. The combinations with GGOs could be useful in the identification and differential diagnosis of COVID-19, alerting clinicians to isolate patients for prompt treatment and repeat RT-PCR tests until the incubation period ends.
This research did not receive any specific grant from funding agencies in the public, commercial, or not-for-profit sectors.
Declaration of competing interest
The authors of this manuscript have no conflicts of interest or relationships with any companies whose products or services may be related to the subject matter of the article.
References
Lu R.
Zhao X.
Li J.
Niu P.
Yang B.
Wu H.
et al.
Genomic characterisation and epidemiology of 2019 novel coronavirus: implications for virus origins and receptor binding.