Search Results
464 results
Number of results per page. Upon selecting an option this page will automatically refresh to update the list of articles to your number selected.Fig. 4
Injurity Severity Scores for those alcohol-positive and alcohol-negative patients in the different age groups (years).
Fig. 4
Injurity Severity Scores for those alcohol-positive and alcohol-negative patients in the different age groups (years).
Fig. 2
Proportion tested positive for alcohol in different age groups (years) in those tested for alcohol, hypothetically assuming that those not tested would have tested negative for alcohol (lower limit estimation of proportion alcohol positive in different age groups).
Fig. 2
Proportion tested positive for alcohol in different age groups (years) in those tested for alcohol, hypothetically assuming that those not tested would have tested negative for alcohol (lower limit estimation of proportion alcohol positive in different age groups).
Fig. 3
Mortality rates in patients positive and negative for alcohol.
Fig. 3
Mortality rates in patients positive and negative for alcohol.
Fig. 1
Proportion of all trauma patients tested for alcohol by age group.
Fig. 1
Proportion of all trauma patients tested for alcohol by age group.
Fig. 1
Screening questions.
Fig. 1
Screening questions.
Fig. 2
ED patient volume and percentage screen positives by day and time.
Fig. 2
ED patient volume and percentage screen positives by day and time.
Fig. 1
Alcohol Use Disorders Identification Test (AUDIT).
Fig. 1
Alcohol Use Disorders Identification Test (AUDIT).
Fig. 4
Venous lactate concentration according to consciousness level in alcohol group.
Fig. 4
Venous lactate concentration according to consciousness level in alcohol group.
Fig. 1
Algorithm for enrollment of patients with alcohol withdrawal seizures; IV, intravenous.
Fig. 1
Algorithm for enrollment of patients with alcohol withdrawal seizures; IV, intravenous.
Fig. 1
Blood alcohol level (mg/dL) distribution in the study.
Fig. 1
Blood alcohol level (mg/dL) distribution in the study.
Fig. 1
Rate of decline in BAC (milligrams per deciliter) in a 14-year-old boy. Logarithmic transformation between time and blood alcohol concentration. Case Y = 1.803 − 0.084× X; R2 = 0.97.
Fig. 1
Rate of decline in BAC (milligrams per deciliter) in a 14-year-old boy. Logarithmic transformation between time and blood alcohol concentration. Case Y = 1.803 − 0.084× X; R2 = 0.97.
Fig. 2
Venous lactate concentration comparison. 2-1, Venous lactate concentrations of all patients analyzed in each group. 2-2, Venous lactate concentrations of patients who underwent liver function tests. 2-3, Venous lactate concentrations of simple alcohol intoxication patients.
Fig. 2
Venous lactate concentration comparison. 2-1, Venous lactate concentrations of all patients analyzed in each group. 2-2, Venous lactate concentrations of patients who underwent liver function tests. 2-3, Venous lactate concentrations of simple alcohol intoxication patients.
Fig. 3
Effects of IM/PO olanzapine, benzodiazepines, and alcohol on decreases in oxygen saturations.
Fig. 3
Effects of IM/PO olanzapine, benzodiazepines, and alcohol on decreases in oxygen saturations.
Fig. 2
Substance use among patients testing positive for alcohol and/or drugs (N = 245).
Fig. 2
Substance use among patients testing positive for alcohol and/or drugs (N = 245).
Fig. 1
Protocol for pharmacologic treatment of AWS. Adapted from Gold et al (2007) [89]) and based on Cook County Hospital ED experience.
Fig. 1
Protocol for pharmacologic treatment of AWS. Adapted from Gold et al (2007) [89]) and based on Cook County Hospital ED experience.
Fig. 1
The relationship between BAC and ISS. N indicates the number of patients.
Fig. 1
The relationship between BAC and ISS. N indicates the number of patients.
Fig. 1
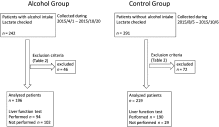
Patient collection algorithm.
Fig. 1
Patient collection algorithm.
Fig. 3
Share of patients with higher lactate concentrations in each group.
Fig. 3
Share of patients with higher lactate concentrations in each group.
Fig. 1
CIWA score over the ED clinical course.
Fig. 1
CIWA score over the ED clinical course.
Fig. 2
Formication. This patient hallucinated during AWS that his scorpion tattoos were entering his body.
Fig. 2
Formication. This patient hallucinated during AWS that his scorpion tattoos were entering his body.


