Search Results
924 results
Number of results per page. Upon selecting an option this page will automatically refresh to update the list of articles to your number selected.Fig. 1
Scatter plot of serum BICARBs and AGs for patients with generalized seizure (cases) and syncope (controls).
Fig. 1
Scatter plot of serum BICARBs and AGs for patients with generalized seizure (cases) and syncope (controls).
Fig. 2
Denver Seizure Score classification. Bars represent 95% CIs.
Fig. 2
Denver Seizure Score classification. Bars represent 95% CIs.
Fig. 3
Receiver operating characteristics curve for the Denver Seizure Score.
Fig. 3
Receiver operating characteristics curve for the Denver Seizure Score.
Fig. 2
A, ECG upon admission: Normal sinus rhythm with wide complex QRS and prolonged QTc: 474 milliseconds.
B, Paroxysmal Supraventricular Tachycardia (PSVT).
C, ECG after control PSVT: Normal sinus rhythm with prolonged QTc: 568 milliseconds.
Fig. 2
A, ECG upon admission: Normal sinus rhythm with wide complex QRS and prolonged QTc: 474 milliseconds.
B, Paroxysmal Supraventricular Tachycardia (PSVT).
C, ECG after control PSVT: Normal sinus rhythm with prolonged QTc: 568 milliseconds.
Fig. 1
A, Baseline ECG: Normal sinus rhythm, Normal QTC interval: 396 milliseconds.
B, ECG upon admission: Normal sinus rhythm with Generalized ST, T, changes with prolonged QTc: 521 milliseconds.
C, ECG upon admission: normal sinus rhythm, Bigeminy premature ventricular complex (R on T wave).
Fig. 1
A, Baseline ECG: Normal sinus rhythm, Normal QTC interval: 396 milliseconds.
B, ECG upon admission: Normal sinus rhythm with Generalized ST, T, changes with prolonged QTc: 521 milliseconds.
C, ECG upon admission: normal sinus rhythm, Bigeminy premature ventricular complex (R on T wave).
Fig. 1
Chest x-ray displaying widened mediastinum.
Fig. 1
Chest x-ray displaying widened mediastinum.
Fig. 2
Computed tomography angiography displaying ascending dissection.
Fig. 2
Computed tomography angiography displaying ascending dissection.
Fig. 1
Details of diagnosis of patients in the UIA and POUD groups.
Fig. 1
Details of diagnosis of patients in the UIA and POUD groups.
Figure
Patient selection flow diagram.
Figure
Patient selection flow diagram.
Fig. 1
Electrocardiogram of one of the patients. The prominent S wave in lead I and R wave in aVR demonstrate the T40-ms rightward axis shift (255°) [16]. The ECG also shows an incomplete RBBB.
Fig. 1
Electrocardiogram of one of the patients. The prominent S wave in lead I and R wave in aVR demonstrate the T40-ms rightward axis shift (255°) [16]. The ECG also shows an incomplete RBBB.
Fig. 1
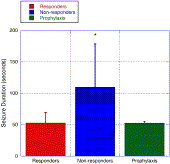
Mean seizure duration for each response group. This demonstrates that phenytoin does not control febrile seizures frequently (n = 9 episodes), but failure to respond to phenytoin (n = 28 episodes) leads to significantly more prolonged seizures.
Fig. 1
Mean seizure duration for each response group. This demonstrates that phenytoin does not control febrile seizures frequently (n = 9 episodes), but failure to respond to phenytoin (n = 28 episodes) leads to significantly more prolonged seizures.
Fig. 1
Algorithm for enrollment of patients with alcohol withdrawal seizures; IV, intravenous.
Fig. 1
Algorithm for enrollment of patients with alcohol withdrawal seizures; IV, intravenous.
Fig. 2
Proposed pathophysiology occurring in recurrent GTC seizure or status epilepticus.
Fig. 2
Proposed pathophysiology occurring in recurrent GTC seizure or status epilepticus.
Fig. 2
Rhythm strip from case 1, showing polymorphic ventricular tachycardia, which correlated with the patient's seizure-like activity.
Fig. 2
Rhythm strip from case 1, showing polymorphic ventricular tachycardia, which correlated with the patient's seizure-like activity.
Fig
Computed tomographic scan of the brain with intravenous contrast.
Fig
Computed tomographic scan of the brain with intravenous contrast.
Fig. 1
Noncontrast CT of the head showing proptosis and retrobulbar fluid of the left eye.
Fig. 1
Noncontrast CT of the head showing proptosis and retrobulbar fluid of the left eye.
Fig. 2
Bloody chemosis and periorbital ecchymosis. Note the relative difficulty in identifying proptosis on frontal view.
Fig. 2
Bloody chemosis and periorbital ecchymosis. Note the relative difficulty in identifying proptosis on frontal view.
Fig. 1
Fig. 2
Magnetic resonance imaging of the brain showing changes in the frontal lobe, which may represent sequela of PRES or transitory changes secondary to seizures.
Fig. 2
Magnetic resonance imaging of the brain showing changes in the frontal lobe, which may represent sequela of PRES or transitory changes secondary to seizures.
Fig. 1
Flow diagram illustrating the derivation of the 2 cases selected for presentation. ICD-9 indicates International Classification of Diseases, Ninth Revision.
Fig. 1
Flow diagram illustrating the derivation of the 2 cases selected for presentation. ICD-9 indicates International Classification of Diseases, Ninth Revision.


