Electrocardiographic manifestations of pulmonary embolism***
Affiliations
- Department of Emergency Medicine, University of Virginia, Charlottesville, VA
Affiliations
- Department of Emergency Medicine, University of Virginia, Charlottesville, VA
Affiliations
- Department of Emergency Medicine, University of Virginia, Charlottesville, VA
Affiliations
- Department of Emergency Medicine, University of California San Diego, San Diego, CA
Affiliations
- Department of Emergency Medicine, University of Maryland, Baltimore, MD.
To view the full text, please login as a subscribed user or purchase a subscription. Click here to view the full text on ScienceDirect.

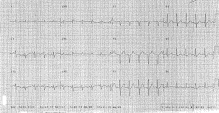
Fig. 1
Case 1, Sinus tachycardia.
Fig. 2
Case 2, T wave inversions in leads V1 to V4.
Fig. 3
Case 4, Right bundle branch block.
Fig. 4
Case 5, Sinus tachycardia with S1Q3T3 pattern.
Fig. 5
Case 6, Normal sinus rhythm with S1Q3T3 pattern not related to PE.
Fig. 6
Atrial fibrillation with a rapid ventricular response is seen in this ECG obtained in a middle-aged female patient with dyspnea after prolonged bed rest. V/Q scanning was high probability for PE. She had no past history of atrial fibrillation.
Fig. 7
Right bundle branch block, signified by an rSR pattern in lead V1 in the setting of a widened QRS complex, in a patient with documented PE. Also note the likely right ventricular hypertrophy (RVH) pattern, large R' wave in lead V1 and large S waves in the mid to left precordial leads. Lastly, the chronic pulmonary disease pattern is suggested in this particular patient, RVH and low voltage in the limb leads.
Fig. 8
Another example of RBBB, RVH, and the chronic pulmonary disease pattern in a patient with PE.
Fig. 9
(A) Sinus tachycardia with nonspecific changes in a patient with dyspnea, plueritic chest pain, and hypoxemia. Subsequent evaluation revealed PE. (B) After admission to a critical care unit, P-pulmonale was noted in this tracing with large P waves in lead II.
Fig. 10
A large S wave in lead I is seen in a PE patient.
Fig. 11
Sinus tachycardia and ST segment depression in leads V2 to V6 in a PE patient.
Fig. 12
ST segment elevation in leads V2 to V5 is seen in a PE patient. Additionally, T wave inversions are also seen in this distribution.
Fig. 13
Numerous findings as suggested by Sreeram et al14 consistent with PE are noted, including incomplete RBBB, right axis deviation (~120 degrees), large S waves in leads I and aVI, and T wave inversions in the anterior and inferior leads. In addition to the Sreeram et al14 criteria, RVH (prominent R' wave in lead V1 with right axis deviation) with strain (ST segment/T wave changes) is noted.
Abstract
The electrocardiogram (ECG) may be entirely normal in the patient with pulmonary embolism (P/E); alternatively, any number of rhythm and/or morphologic abnormalities may be observed in such a patient. The abnormal ECG may deviate from the norm with alterations in rhythm, in conduction, in axis of the QRS complex, and in the morphology of the P wave, QRS complex, and ST segment/T wave. The electrocardiographic findings associated with PE are numerous, including arrhythmias (sinus tachycardia, atrial flutter, atrial fibrillation, atrial tachycardia, and atrial premature contractions), nonspecific ST segment/T wave changes, T wave inversions in the right precordial leads, rightward QRS complex axis shift and other axis changes, S1Q3 or S1Q3T3 pattern, right bundle branch block, and acute cor pulomnale. This review focuses on the ECG and the various abnormalities seen in the patient with PE. (Am J Emerg Med 2001;19:514-519. Copyright © 2001 by W.B. Saunders Company)
To access this article, please choose from the options below
Purchase access to this article
Claim Access
If you are a current subscriber with Society Membership or an Account Number, claim your access now.
Subscribe to this title
Purchase a subscription to gain access to this and all other articles in this journal.
Institutional Access
Visit ScienceDirect to see if you have access via your institution.
Related Articles
Searching for related articles..


