The pediatric electrocardiogram
Part I: Age-related interpretation
Affiliations
- Department of Pediatrics, Children's Medical Center, University of Virginia Health System, Charlottesville, VA 22908, USA
Affiliations
- Division of Cardiology, Department of Pediatrics, Children's Medical Center, University of Virginia Health System, Charlottesville, VA 22908, USA
Affiliations
- Department of Emergency Medicine, University of Virginia Health System, Charlottesville, VA 22908, USA
Correspondence
- Corresponding author.

Affiliations
- Department of Emergency Medicine, University of Virginia Health System, Charlottesville, VA 22908, USA
Correspondence
- Corresponding author.
To view the full text, please login as a subscribed user or purchase a subscription. Click here to view the full text on ScienceDirect.

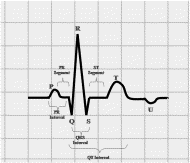
Fig. 1
Idealized ECG waveform demonstrating constituent waves and intervals. Standard paper speed is 25 mm/s. Time is represented along horizontal axis; each small block represents 0.04 seconds. Voltage amplitude is represented along the vertical axis; each small block represents 0.1 mV.
Fig. 2
First-degree AV block in a young boy undergoing Holter monitoring. Note the markedly prolonged PR interval.
Fig. 3
Type I second-degree AV block from a Holter recording in a 7-year-old male with congenital complete heart block. Note the progressive prolongation of the PR interval during the first 2 beats.
Fig. 4
Third-degree AV block seen in the same patient as in Fig. 6 . Note that there is no relationship between P waves and QRS complexes.
Fig. 5
Normal neonatal ECG in a 1-week-old infant. QRS axis is 125°, which would be considered right axis deviation in an adult. Note the tall R waves in V1, V2, and V3, which are normal.
Fig. 6
Electrocardiogram of a 4-year-old healthy male. Mean QRS vector is 83°. Note the inverted T waves in V2 and V3, which are normal for age.
Fig. 7
Normal ECG in an adolescent male. QRS axis is 84°, which is normal for age. Note the change in the QRS complex amplitudes compared with the ECG of the neonate.
Fig. 8
ECG in neonate with Down syndrome and atrioventricular canal defect before surgical repair. Mean QRS vector is −87°, which closely corresponds to “superior axis deviation.”
Fig. 9
Prolonged QT interval in an 18-year-old female with familial long QT syndrome and a history of cardiac arrest. The QT interval calculated by Bazett's formula is 506 milliseconds.
Fig. 10
T-wave changes in a single patient over childhood. The first panel shows upright T waves in V2 during the first month of life. The second panel shows inverted T waves in V2 at 3 years of age. Third panel shows upright T waves at 22 years of age.
Fig. 11
Right ventricular hypertrophy in a 10-year-old male with primary pulmonary hypertension. Note the tall R waves in V1 and V2 and the deep S waves in V5 and V6. Right axis deviation is also present.
Fig. 12
Left ventricular hypertrophy in a 3-year-old boy with unrepaired coarctation of the aorta. Note the deep S waves in V1 and V2 with tall R waves in V4 and V5.
Abstract
Emergency physicians attending to pediatric patients in acute care settings use electrocardiograms (ECGs) for a variety of reasons, including syncope, chest pain, ingestion, suspected dysrhythmias, and as part of the initial evaluation of suspected congenital heart disease. Thus, it is important for emergency and acute care providers to be familiar with the normal pediatric ECG in addition to common ECG abnormalities seen in the pediatric population. The purpose of this 3-part review will be to review (1) age-related changes in the pediatric ECG, (2) common arrhythmias encountered in the pediatric population, and (3) ECG indicators of structural and congenital heart disease in the pediatric population.
To access this article, please choose from the options below
Purchase access to this article
Claim Access
If you are a current subscriber with Society Membership or an Account Number, claim your access now.
Subscribe to this title
Purchase a subscription to gain access to this and all other articles in this journal.
Institutional Access
Visit ScienceDirect to see if you have access via your institution.
Related Articles
Searching for related articles..


