
Acuity, treatment times, and patient experience in Freestanding Emergency Departments affiliated with academic institutions
Correspondence / American Journal of Emergency Medicine 36 (2018) 134-168 139
treatment times, and patient exp”>References
Murthy VH. Ending the opioid epidemic-a call to action. NEJM 2016;375(25): 2413-5.
Emergency department Prescription opioids as an initial exposure preceding addic- tion. Ann Emerg Med 2016;68(2):202-8.
Davis EE, Deinard AS, Maiga EW. Doctor, my tooth hurts: the costs of incomplete
dental care in the emergency room. J Public Health Dent 2010;70(3):205-10.
Trieger N, Gillen GH. Bupivacaine anesthesia and post-operative analgesia in oral surgery. Anesth Prog 1979;26(1):20.
Acuity, treatment times, and patient experience in Freestanding Emergency Departments affiliated with academic institutions


The first goal of the Institute for Healthcare Improvement (IHI) Tri- ple Aim Initiative is to “improve the patient experience of care (includ- ing quality and satisfaction).” Our goal was to evaluate and compare common ED quality metrics, and patient satisfaction scores specifically
Table 1
Average triage level of patients seen in FEDs compared to national averages.a
|
Triage level |
Study FED average % for 2014 (“n” = 114,053) |
National ED average % for 2014b (“n” = 136.3 M) |
|
Level 1 (resuscitation) |
0.19%a |
2% |
|
Level 2 (emergent) |
5.53%a |
7.8% |
|
Level 3 (urgent) |
44.12%a |
30% |
|
Level 4 (semi-urgent) |
44.27%a |
34.7% |
|
Level 5 (non-urgent) |
4.05%a |
25.4% |
a Indicates a statistically significant difference between study FED and national ED, p b
0.001.
b Medicare hospital outpatient and physician claims.
at 8 Freestanding Emergency Departments (FEDs) affiliated with aca- demic institutions to both national Emergency Department (ED) data and to EDs with similar volume.
While there are few FEDs affiliated with academic institutions at this time, several institutions have plans to build them in order to expand pa- tient coverage and increase training opportunities. Regarding all FEDs, Jere- miah Schuur, et al., had noted that between five and 10% of all emergency care is now provided in FEDs [1]. Patidar et al. noted a 121% increase in FEDs and an 1129% increase in independent FEDs from 2007 to 2013 [2].
The FEDs in our study represent three affiliated with Cleveland Clin- ic, three from Baylor College of Medicine, one from the University of Utah, and one from Northwell Health.1 Data were derived from Elec- tronic Health Record (EHR) data of 147,053 patient visits for these facil- ities in 2013 and 2014. All facilities are staffed almost exclusively (99%) by BC/BE Emergency Physicians. FEDs affiliated with Cleveland Clinic, Northwell, and Utah all receive ambulances. Northwell’s Lenox Health FED receives 46% of their patients from ambulance services, which is one of the highest percentages in New York City.
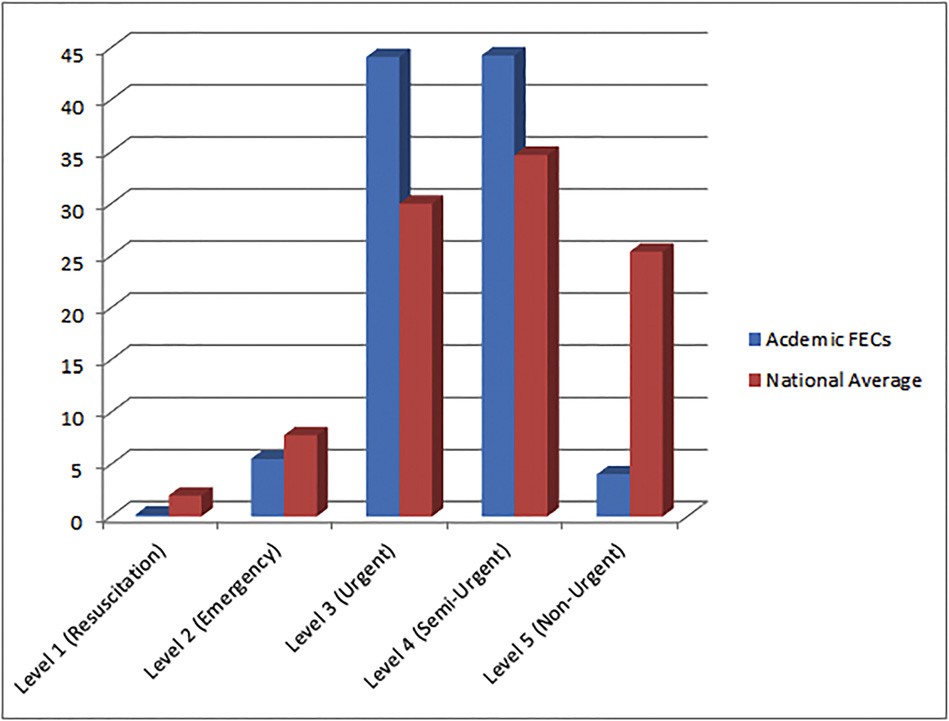
Chart 1. Average triage level of patients seen in academic FEDs compared to national averages*.
We evaluated Acuity levels, wait times, treatment times, and patient satisfaction data. We performed a retrospective chart review using EHRs and Hospital Outpatient Quality Reports (HOQR) submitted to the Cen- 
ter for Medicare and Medicaid Services (CMS). These results were 1 Affiliated with Hofstra Northwell School of Medicine at Hofstra University.
140 Correspondence / American Journal of Emergency Medicine 36 (2018) 134-168
Table 2
Average treatment times for patients in FEDs Compared to national averages and EDs with similar patient census.
Treatment times (in minutes) Study FED average +- standard deviation in 2014, with (95% CIs) (“n” = 66,785)
National ED averages in 2014 (“n” = 39,553,332)
ED with similar census (under 20,000 ED visits) (“n” = 2,759,024)
Summary type Average Average Median
Median time in waiting room (EHR) 10 +- 7.9 (0.45, 20.3) 16a 13b
Time from door to diagnostic evaluation by a qualified medical provider (OP-20)
23 +- 11.2 (9.1, 37.0) 27a 22b
Treatment time for discharged patients (OP-18a) 142 +- 57.2 (71.8, 213.9) 147a 121b
Treatment time for admitted patients (0P-18d) 312 +- 113.1 (172.4, 453.3) 290a 238b
a CMS Hospital Compare data.
b Emergency Department Benchmarking Alliance.
Table 3
Comparison of treatment time for long bone fracture in academic FEDs compared to na- tional average.
higher patient satisfaction, and fewer patients Left without being seen. Academic FEDs had similar waiting room times, treatment times, and time to pain management compared to national benchmarks. Therefore,
Study FED average +- standard deviation in 2014 (95% CI) (“n” = 66,785)
National average (“n” = 136.3 M)
FEDs offer a great value proposition as they have similar quality metrics with better patient satisfaction.
Time to pain medication for long bone fractures (OP-21)
50 +- 17.55 (28.6, 72.2) 53a
Acknowledgements
Baylor College of Medicine: Shetera Carter, Caroline Okemwa RN.
a CMS Hospital Compare Data.
compared to both national ED averages using CMS data and to EDs with similar patient volume using data from the Emergency Department Benchmarking Alliance (EDBA). We evaluated patient satisfaction using Press-Ganey scores. Using EHR data, we calculated arithmetic means for the FEDs in our cohort. Confidence intervals for each quality metric from the 8 academic FEDs were calculated to determine whether or not they contained the point estimates for hospital-based emergency departments from CMS and EDBA.
Regarding acuity, using the Emergency Severity Index triage system, the academic FEDs saw a lower percentage of both Level 1 and 2 patients, a higher percentage of Level 3 and 4 patients, and a markedly lower percent- age of Level 5 patients compared to national averages (Chart 1, Table 1).
Compared to national averages, waiting room times (10 vs. 16 min) and treatment times (142 vs. 147 min) were similar. Compared to EDs with similar census, waiting room times were similar (10 vs. 13 min). Treatment times for admitted patients were longer, yet statistically in- distinguishable, at FEDs (312 vs. 238 min) compared to CMS and EDBA benchmarks. (Table 2)
Simon et al. have shown that FEDs meet national guidelines for both STEMI [3] and trauma care [4]. Compared to national averages, time to pain medication for long bone fractures at Academic FEDs was compara- ble to the national average (50 vs. 53 min). (Table 3)
The percentage of patients who left without being seen was much lower than both the national average (0.4 vs 2.1%) and for EDs with similar census (0.4 vs 1.6%). Patient satisfaction scores were higher than national averages (91st percentile vs 50th percentile). The rate of patients that left academic FEDs Against Medical Advice (AMA) was very low at 0.65%. (Table 4)
Compared to national averages, academically affiliated FEDs had overlap in the Acuity of patients treated. The similarity to national aver- ages is seen for both ESI level 3 and 4 patients, which comprise the vast majority of patients seen at FEDs. Our cohort had shorter wait times,
Northwell: John D’Angelo, MD, Senior Vice President and Executive Director, Emergency Medicine Services, Northwell Health.
University of Utah: Darryl Barfuss and Mahima Saseendran, Univer- sity of Utah Quality Information; Rod L. Martin, Director, Baker Tilley.
Cleveland Clinic: Dave Hayslip RN,BSN Emergency Services Institute, Ann Salvator, MS Research Administration, Cleveland Clinic Akron General.
John R. Dayton, MD Division of Emergency Medicine, University of Utah School of Medicine, 30 North 1900 East, 1C026, Salt Lake City, UT 84132, USA
Corresponding author.
E-mail address: [email protected]
Cedric K. Dark, MD, MPH Division of Emergency Medicine, Baylor College of Medicine, Emergency Center, Ben Taub Hospital, 1504 Taub Loop, Houston, TX 77030, USA
E-mail address: [email protected]
Eric S. Cruzen, MD, MBA
Hofstra Northwell School of Medicine, 500 Hofstra Blvd, Hempstead, NY
11549, USA
E-mail address: [email protected]
Erin L. Simon, DO
Department of Emergency Medicine, Cleveland Clinic Akron General, 1
Akron General Ave, Akron, OH 44307, USA E-mail address: [email protected]
11 May 2017
http://dx.doi.org/10.1016/j.ajem.2017.07.004
Table 4
Patient satisfaction metrics for academic FEDs compared to national ED average and EDs with similar census.
Satisfaction metrics Study FED average for 2014
(“n” = 114,053)
National ED average for 2014 (“n” = 39,553,332)
ED with similar census (“n” = 2,759,024)
Percentage of patients who left without being seen (OP-22)d 0.40% 2.1%a 1.6%b
Average Press Ganey percentile scores 91.54% +- 1.76c (88.1, 94.9) 50%c NA
a CMS Hospital Compare Data.
b Emergency Department Benchmarking Alliance.
c Press-Ganey Data.
d Study FED vs. national ED, study FED vs. ED with similar census, and Press-Ganey comparisons were statistically significant with p b 0.001.
Correspondence / American Journal of Emergency Medicine 36 (2018) 134-168 141
References
- Schuur JD, et al. Where do freestanding emergency departments choose to locate? A national inventory and geographic analysis in three states. Ann Emerg Med 2017; 69(4):383-92.
- Patidar N, et al. Rapid growth in the number of U.S. freestanding emergency depart- ments between 2007 and 2013: 704. Acad Emerg Med 2015;22 (Supplement 1):S303.
- Simon EL, et al. Door-to-balloon times from freestanding emergency departments meet ST-segment elevation myocardial infarction reperfusion guidelines. J Emerg Med 2014;46(5):734-40.
- Simon EL, et al. Freestanding emergency departments and the trauma patient. J Emerg Med 2015;48(2):152-7.
Adverse events from physostigmine: An observational study ?,??,?

Physostigmine is a short-acting acetylcholinesterase inhibitor used to reverse delirium from acute antimuscarinic toxicity [1]. It increases synaptic acetylcholine overcoming postsynaptic blockade from muscarinic antago- nists. Compared to benzodiazepines for Antimuscarinic delirium, physostig- mine has been shown to be more effective and safer [2]. Despite superior efficacy, a culture of reluctance for using this antidote has persisted. Several reasons are possible including the presence of old publications describing serious adverse events temporally related to physostigmine use [3]. The aim of this investigation was to evaluate adverse events after receiving phy- sostigmine for antimuscarinic toxicity in Contemporary practice.
A retrospective, observational chart review was completed at a 1125- bed urban tertiary care hospital. Patients with electronic physostigmine orders from 2007 to 2016 were retrospectively identified from electronic medical records. Inclusion criteria included: patients one year or older having received physostigmine in the hospital for suspected antimuscarinic toxicity. Exclusion criterial included: incarcerated pa- tients, absent data, or patients who did not receive physostigmine.
The primary outcome was adverse events temporally associated with the administration of physostigmine. Adverse events included: sei- zure, bradycardia (requiring atropine), dysrhythmia, nausea/vomiting, incontinence or diarrhea, respiratory distress requiring treatment, and respiratory distress requiring intubation within 60 min of physostig- mine administration. Secondary outcomes included changes in vital signs, ECG measurements, and CNS stimulation scale pre and post phy- sostigmine. The scale used for grading CNS stimulation severity was adapted from a previously published scale used for amphetamine poi- soning and has been used to describe the severity of antimuscarinic tox- icity [2]. The CNS stimulation score is a 5-point likert scale based on the following indices: 0 = relaxed, cooperative; 1 = anxious, irritable, tremulous, 2 = intermittently or mildly disoriented, confused, and hal- lucinating, moderate agitation and motor hyperactivity; 3 = incompre- hensible speech, marked agitation and motor hyperactivity (requiring restraints); 4 = seizures, deep coma (unresponsive to voice or pain).
Eighty-seven charts were reviewed for study inclusion. Thirty-one were excluded for having orders but not receiving physostigmine dur- ing baclofen pump insertion and two were excluded for missing data. Complete data was available for 54 patients. The mean age was 30 (range 3-68 years) with 52% male gender. Approximately 54% of pa- tients ingested an antihistamine and 57% of patients had a multi-drug overdose. Most patients presented with typical antimuscarinic toxidrome signs and symptoms with over 80% of patients being
? An abstract of this data was presented at the North American Congress of Clinical Toxicology annual meeting held in Boston, MA 2016.
?? Authors have no conflicts of interest or sources of financial support to disclose.
? Manuscript prepared and assembled in 2015-2017 at the Virginia
Commonwealth University in Richmond, VA.
reported as having delirium. Other common symptoms included mydri- asis, Dry skin or mucous membranes, and agitation.
Physostigmine was administered intravenously in all 54 cases. Forty-three percent of patients received an initial dose of 2 mg, regard- less of acuity of ingestion and 39% received a subsequent dose, resulting in a total mean dose of 2.2 mg. Benzodiazepines were given in 70% of cases. In 17% of cases, patients received no additional therapy besides physostigmine.
In our cohort of patients, there were no seizures or cardiac arrest documented. Only five patients experienced clinically significant ad- verse events including nausea/vomiting and one patient had an in- creased oxygen requirement that resolved with an albuterol and ipratropium treatment. Five patients underwent endotracheal intuba- tion, but none were felt to be related to physostigmine. Intubations were documented as being indicated for airway protection due to ex- cessive sedation from the ingestion or chemical restraint due to refrac- tory agitation. Eighty-seven percent of patients had improvement in CNS stimulation grade after administration of physostigmine (43% of patients improved to relaxed, cooperative and 35% improved to anxious, irritable, and tremulous). A majority of patients received an ECG before physostigmine administration (83%), but only 48% had a post-physo- stigmine ECG at a median time of 500 min after physostigmine was ad- ministered. No Clinically significant changes in ECG were identified when pre and post physostigmine intervals were compared. The only clinically significant change in vital signs pre and post physostigmine was a decrease in mean heart rate of 15 beats/min. The lowest heart rate observed post-physostigmine was 57 beats/min in a 28 year old male who also ingested heroin and alprazolam.
This study has several limitations. Its retrospective nature limits the quality of data and completeness of observations pre and post physostig- mine use. At the time of physostigmine administration, exposure to drug was historical and not validated by confirmatory testing. Mental status of the patients in this study was subjectively determined by the healthcare providers and subsequently by the abstractors. Only 48% of our patients received post-physostigmine ECGs at a median time 500 min, which may have resulted in significant ECG changes being missed. Definitive safety assessments cannot be made with a relatively small number of cases.
In conclusion, our observational study revealed no serious adverse events when physostigmine was used for treating antimuscarinic toxic- ity in a contemporary practice.
Disclosures
All contributors to this manuscript are listed as authors. The authors have no conflicts of interest to disclose. No financial support was uti- lized during the research and/or preparation of the article.
Acknowledgements
The authors thank Perry Taylor, PharmD for his help abstracting re- cords prior to data collection.
Tammy T. Nguyen, PharmD Department of Emergency Medicine, Virginia Commonwealth University Medical Center, PO Box 980401, Richmond, VA 23298, United States Department of Pharmacy, Virginia Commonwealth University Medical Center, PO Box 980042, Richmond, VA 23298, United States Corresponding author at: Department of Emergency Medicine, VCU Medical Center, Richmond, VA, P.O. Box 980401, 1250 E Marshall St,
Richmond, VA 23298-0401, United States.
E-mail address: [email protected]
Cristina Armengol, MD Greggory Wilhoite, DO
Department of Emergency Medicine, Virginia Commonwealth University Medical Center, PO Box 980401, Richmond, VA 23298, United States

