
The correlation between elevated cardiac troponin I and pulmonary artery obstruction index in ED patients with pulmonary embolism
Original Contribution
The correlation between elevated cardiac troponin I and pulmonary artery obstruction index in ED patients with pulmonary embolism
Hamid Shokoohi MD, MPHa,?, Robert Shesser MD, MPHa,
Jeffrey P. Smith MD, MPHa, Michael C. Hill MDb, Robert Hirsch PhDc
aDepartment of Emergency Medicine, The George Washington University, Washington, DC 20037, USA
bDepartment of Radiology, The George Washington University, Washington, DC 20037, USA
cSchool of Public Health and Health Services, The George Washington University, Washington, DC 20037, USA
Received 14 October 2007; revised 24 March 2008; accepted 24 March 2008
Abstract
Objectives: The aim of this study is to investigate the correlation between Cardiac troponin I values and the pulmonary artery obstruction index assessed with spiral computed tomography scan in emergency department (ED) patients with pulmonary embolism (PE).
Methods: This is a retrospective cohort study of all 179 ED patients diagnosed with PE between December 2004 and January 2007. Study population consisted of 104 (58.1%) of 179 patients with PE in whom both cTnI was measured and a contemporaneously performed CT scan was available for review. In these patients, the levels of cTnI measured in the ED were correlated with the degree of pulmonary vascular obstruction determined by applying the modified Computed Tomography Obstruction Index to the spiral CT scan performed in the ED.
Results: troponin values were elevated in 20 (19.2%) of 104 patients (95% confidence interval [CI], 11.6-26.8) with a mean cTnI concentration of 0.38 +- 0.44 ug/L. Elevated cTnI value had a significant correlation with main pulmonary arteries involvement using the modified Computed Tomography Obstruction Index score (P = .0001). Elevated ED cTnI value had 53.8% (95% CI, 37.6-66) sensitivity and 92.3% (95% CI, 87-96.4) specificity, 70% (95% CI, 49-86) PPV, and 85.7% (95% CI, 80.7-90)
NPV for predicting main pulmonary artery obstruction on CT. Increased cTnI values were highly correlated to intensive care unit admission of patients with PE (RR, 12.83; 95% CI, 3.87-42.4).
Conclusions: Measuring cTnI value might be considered in ED patients who are suspected of having PE. Elevated cTnI should raise the clinician’s concern for the possibility of central pulmonary vascular obstruction.
(C) 2009
The study was presented as an oral presentation at the SAEM 2007 Annual Meeting on May 16 to 19, Chicago.
The abstract was presented at the Ninth Annual SAEM Mid-Atlantic Regional Research Forum in November 2006 at the George Town University. A full report on the presentation has been published on the ACEP NEWS vol.26, no. 10, October 2007, page 10.
* Corresponding author. Tel.: +1 202 741 2911; fax: +1 202 741 2921.
E-mail addresses: [email protected] (H. Shokoohi).
0735-6757/$ - see front matter (C) 2009 doi:10.1016/j.ajem.2008.03.033
Introduction
Rapid assessment of the severity of pulmonary vascular obstruction in emergency department (ED) patients with pulmonary embolism (PE) avoids the risks associated with both under- and overtreatment. proximal clots in the main pulmonary artery and an elevated total Clot burden correlate with the severity of arterial bed obstruction and right ventricular dysfunction [1-3].
Proximal level of the clot and high pulmonary artery obstruction index (PAOI) have been shown to be associated with poor Short-term outcome in patients with PE [1,2]. These markers have been validated in several studies, and most of these studies have demonstrated a significantly worse outcome in patients with high PAOI [3-5].
Cardiac troponin is released into the systemic circulation in patients experiencing right ventricular shear stress that results in right ventricular microinfarction [6-8].
The use of cardiac troponin I (cTnI) as an indicator of PE severity has been widely studied in the intensive care unit setting, but only a few studies have examined its use for ED risk stratification of patients with PE [9-13].
In this study, we investigate whether the elevated value of cTnI correlate with the proximal extension of the clot and severity of PE in the ED.
Methods
Study design
This study was a retrospective cohort study of patients with PE presenting to the ED. The records of all patients presented between December 1, 2004, and January 31, 2007, were reviewed, and those with a diagnosis of PE were included in the study. The university institutional review board approved the study protocol.
Study setting and population
The study was conducted at the ED of a university hospital with 62 000 ED visits per year, in which all encounters are recorded in an electronic medical record. The records of all patients with an ED diagnosis of PE consistent with Inter- national Classification of Diseases, 10th Revision codes during study enrollment period were identified. Patients with multiple diagnosis on admission who had PE as part of the final diagnosis were included as the codes for PE, which were assigned automatically by digital medical record system, were searched. Eligible patients were those in whom both cTnI was measured and a contemporaneously performed computed tomography (CT) scan was available for review. Patients were excluded if they did not have a cTnI measured or a CTscan available, had chronic PE, or were known to have active coronary artery or end-stage renal diseases.
Study protocol
Investigators reviewed the ED medical records of patients with final diagnosis of PE consistent with International Classification of Diseases, 10th Revision codes to retrieve the Demographic and clinical data, to investigate the presence of comorbidities, and to determine the values of cTnI. Pertinent demographic data, components of clinical informa- tion, and laboratory values were recorded using a structured data collection instrument.
serum troponin measurement was performed through a 1- step enzyme immunoassay test on the Dimension RXL system (Dade Behring, Newark, DE). The upper limit of the reference range for Healthy adults, the 99th percentile of the reference range, was 0.08 ug/L. Only patients with a troponin measured in the ED were included in the analysis. The CT images were retrieved from the radiology department‘s archiving system for verification of diagnosis, determination of the most proximal level of the embolus, and for the calculation of Computed Tomography Obstruction
Index (CTOI).
The presence of the embolus was defined as low- attenuation Filling defects within the pulmonary arterial tree. The proximal extension of the embolus was classified into 4 levels of the main pulmonary artery, lobar, segmental, and subsegmental vessels involvement [1,14,15].
The CTOI was calculated based on the largest affected vessel in each lung. It was constructed by assigning a number to each of the 4 main affected vessels as 4 for main pulmonary artery, 3 for lobar, 2 for segmental, and 1 for subsegmental involvement regardless of the degree of obstruction in each lung and reported as a total accumulating CTOI. This index correlates well (r = 0.867, P b .0001) with the PAOI, defined as (n x d), where n is the number of segmental arteries occluded and d is the degree of obstruction [1,14,16].
The lead author calculated the index for each individual patient by using a schematic of the pulmonary arterial tree with oversight from an attending radiologist. Interobserver agreement was determined by having a second radiologist with a subspecialty in chest and body imaging, blinded to the initial determination, independently calculating a CTOI for each case. Both observers were blinded to the clinical history and cTnI values at the time of interpretation.
The primary outcome measure was the most proximal burden of the embolus and the degree of pulmonary vascular obstruction in CT scans. Secondary outcomes included intensive care unit admissions and ED mortality among patients with PE who had cTnI values measured in the ED.
Data analysis
Data were entered into a Microsoft Excel 2005 database and imported into SAS (Version 8.2 SAS Institute, Inc Cary, NC) statistics software. Proportions and frequency distribu-
tions were calculated for categorical variables and means (SD) for continuous variables. spearman correlation coeffi- cients were examined between continuous variables. Student t test and Mann-Whitney test were used to compare continuous and nonparametric variables, respectively. Com- parisons of dichotomous parameters were made between cTnI-positive and cTnI-negative patients using the Fisher exact test. The Cochran-Armitage trend test was used to examine the association between cTnI values and the level of pulmonary vascular obstruction. Interobserver variability in the first and second CT scan rating was assessed using weighted ? (?w) scores. Strength of agreement was considered fair for weighted ? values of 0.21 to 0.40, moderate for values of 0.41 to 0.60, good for values of 0.61 to 0.80 and perfect agreement for values of 0.81 to 1.00. All statistical tests were 2-sided. A P value less than .05 was considered significant.
Results
The number of PE diagnoses in the ED during the study period was 179 patients. We excluded a total of 75 patients from our final analysis: 52 patients who did not have a cTnI measured, 14 patients who did not have an available CT, 4 patients with chronic PE, 2 patients with active coronary artery disease, 2 patients with end-stage renal disease, and a patient with an automatic implantable cardioverter-defibril- lator firing before admission. The final study group consisted of 104 patients with acute PE in whom both cTnI was measured, and a contemporaneously performed CT scan was available for review. The study group included 61 women and 43 men with a mean age of 51 +- 15 years.
Elevated cTnI (N0.08 ug/L) was detected in 20 (19.2%) of
104 patients (95% confidence interval [CI], 11.6-26.8). Patients with elevated cTnI had a mean cTnI concentration of
0.38 +- 0.44 ug/L (95% CI, 0.2-0.57) and a peak level of 2.01 ug/L that was seen in a patient with large, saddle PE. Of the 20 patients with elevated cTnI, 16 (80%) were female.
The mean time between the onset of the patients’ symptoms and ED presentation was 28.9 +- 31.1 hours (95% CI, 15.3-42.5) in patients with elevated cTnI and 44 +-
41.9 hours (95% CI, 35-53) in those with normal cTnI (Table 1).
The most proximal extension of the embolus was the main pulmonary artery in 26 (25%) patients with PE, lobar arteries in 33 (31.7%), segmental in 36 (34.6%), and the subseg- mental in 9 (8.7%). Main pulmonary artery involvement was determined in 14 (70%) of 20 (95% CI, 50-90) patients with
elevated cTnI and in 12 (14.3%) of 84 (95% CI, 6.8-21.8) patients without cTnI elevation (P = .0001) (Fig. 1).
Troponin elevation had a sensitivity of 53.8% (95% CI, 37.6-66), specificity of 92.3% (95% CI, 87-96.4), PPV of
70% (95% CI, 49-86), and NPV of 85.7% (95% CI, 80.7-
90) for the prediction of the main pulmonary artery involvement. A significant correlation was found between the most proximal level of thrombus and the median values of CTOI in patients with main pulmonary artery involve- ment (r = 0.92).
The ? scores for interobserver agreement on CT image interpretation was 0.9 for main pulmonary artery emboli (95% CI, 0.77-0.98), 0.84 for lobar involvement (95% CI,
0.64-0.92), and 0.64 for subsegmental emboli (95% CI,
0.47-0.81).
There were 15 (75%) of 20 patients with high cTnI levels (95% CI, 56-94) and 11 (13.1%) of 84 patients with normal cTnI (95% CI, 5.9-20.3) who were admitted to the ICU (P b
.0001) (Fig. 2). A thrombolytic agent was administered to 4 patients during their ED admission. All 4 of these patients had increased cTnI values with a mean concentration of
1.12 +- 0.32 ug/L and thrombus extending to the main pulmonary artery. One of these patients required endotra- cheal intubation and cardiopulmonary resuscitation in ED and died after a failed embolectomy. All other patients survived to ED disposition.
Discussion
The correlation between elevated cTnI and adverse outcome in PE has been demonstrated in several studies [8- 12]. In the most recent meta-analysis by Becattini et al [17], which included all reported studies between 1998 and 2006, they found a consistent increased mortality and adverse outcomes (shock, need for thrombolysis, intuba- tion, catecholamine infusion, cardiopulmonary resuscita- tion) in patients with PE and elevated troponin. In this meta-analysis, 122 (19.7%) of 618 patients with elevated

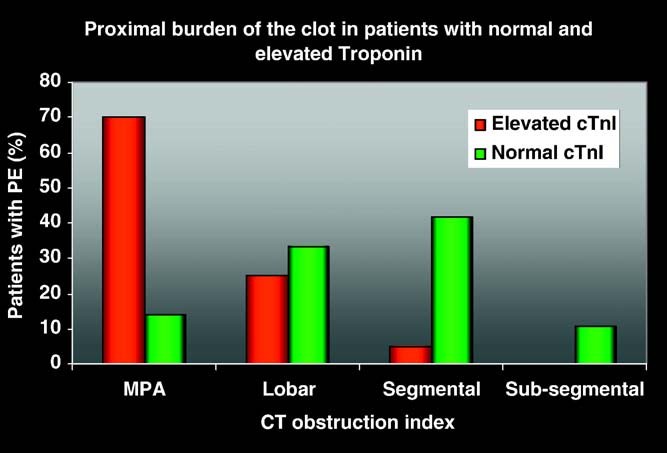
Fig. 1 Proximal burden of the clot in patients with normal and elevated troponin.
troponin died (95% CI, 16.6-22.8) as compared with 51
(3.7%) of 1367 with normal troponin (95% CI, 2.7-4.7). Elevated troponin levels were significantly associated with short-term mortality (odds ratio [OR], 5.24; 95% CI, 3.28- 8.38), with death resulting from PE (OR, 9.44; 95% CI, 4.14-21.49), and with adverse outcome events (OR, 7.03; 95% CI, 2.42-20.43) [17].
Our study of a series of undifferentiated ED patients developed over several years demonstrated that elevated cTnI values were correlated with a more proximal embolus location and higher degree of pulmonary artery obstruction in ED patients with PE. The cTnI elevation exhibited a high NPV with regard to prediction of main pulmonary artery involvement, suggesting that normal cTnI values measured in the ED lower the likelihood of central PE. The results of this study are consistent with the findings in similar studies including a study by Ghanima et al [1] showing that proximal emboli created more severe clinical symptoms as determined by blood oxygenation, biochemical and radiological para- meters [18].
Our clinical policy at the time of study was to admit all patients with new pulmonary embolic disease diagnosed in the ED. Patients with elevated cTnIs had a greater likelihood of admission to the ICU or telemetry unit. The decision to
admit a patient to the ICU may in part be influenced by the results of the cTnI test. However, there was not a clinical policy in either the admission or critical care placement decisions based on the level of cTnI. All 4 patients who received the Thrombolytic treatment and the only patient who died in the ED had an increased cTnI values at the time of presentation supporting the association between elevated cTnI and the severity of the clinical presentation. The results are consistent with those of Konstantinides et al [6], who reported that both cTnT and cTnI, with high cutoff concentrations for both, predict inhospital events in patients with acute PE.
In this retrospective study, we had a lack of control over time of troponin test ordering in which we could not comment on the exact duration between the onset of symptoms and the time that troponin levels have been tested. It is likely that in some patient we missed the elevated level of troponin because patients were presented too early for the troponin elevation to be apparent. Sequential ED cTnI determinations should be considered in ED patients with long lengths of stay and recent onset of symptoms.
These findings suggest that cTnI measurement can be used as part of Prognostic markers for rapid risk stratification of patients with PE. Troponin may support identifying patients with PE who may be benefited from early utilization of additional investigations including bedside echocardio- graphic examination and to streamline the management of patients with PE in the ED.
Limitations
The conclusions may be biased because 41.8% of ED patients with PE were excluded from the analysis primarily due to absence of a cTnI drawn in the ED or contempor- aneously performed CT. Failure to measure sequential troponins in patients with Short duration of symptoms may have lead to an underestimation of the proportion of patients with severe emboli and a positive troponin. The study’s conclusions have limits that are inherent to retrospective
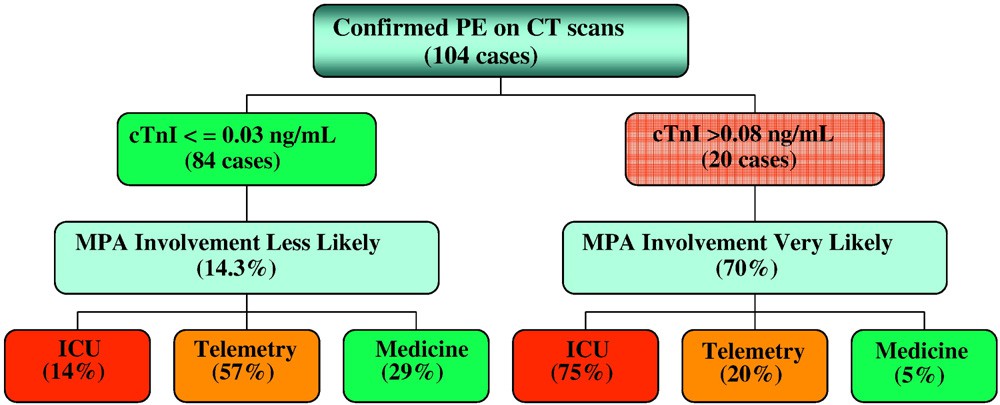
Fig. 2 Troponin-based stratifying algorithm of main pulmonary artery involvement and ED.
chart reviews including lack of control over time of test ordering, incomplete outcomes assessments, and lack of estimate of magnitude nor control for missed cases.
Conclusions
troponin elevations in ED patients with PE may support identifying a subgroup of patients with more extensive pulmonary vasculature obstruction. An elevated cTnI in ED patients with PE might raise the clinician’s concern for possibility of central pulmonary vascular obstruction especially in those patients without obvious clinical evidence of circulatory compromise. In these patients, considering further studies such as 2-dimensional echocar- diography may be pursued expeditiously to precisely risk- stratify the patient.
Sequential ED cTnI determinations should be considered in ED patients with long lengths of stay and recent onset of symptoms.
The exact role and best response to cTnI elevations in ED patients with PE would benefit from a prospective evaluation.
References
- Ghanima W, Abdelnoor M, Holmen LQ, et al. The association between the proximal extension of the clot and the severity of pulmonary embolism (PE): a proposal for a new radiological score for PE. J Intern Med 2007;261(1):74-81.
- Ghaye B, Ghuysen A, Bruyere PJ, D’Orio V, Dondelinger RF. Can CT pulmonary angiography allow assessment of severity and prognosis in patients presenting with pulmonary embolism? What the radiologist needs to know. Radiographics 2006;26:23-39.
- Ghuysen A, Ghaye B, Willems V, et al. Computed tomographic pulmonary angiography and prognostic significance in patients with acute pulmonary embolism. Thorax 2005;60:956-61.
- van der Meer RW, Pattynama PM, van Strijen MJ, et al. Right ventricular dysfunction and pulmonary obstruction index at helical CT:
prediction of clinical outcome during 3-month follow up in patients with acute pulmonary embolism. Radiology 2005;235:798-803.
- Wu AS, Pezzullo JA, Cronan JJ, Hou DD, Mayo-Smith WW. CT pulmonary angiography: quantification of pulmonary embolus as a predictor of patient outcome-initial experience. Radiology 2004;230: 831-5.
- Konstantinides S, Geibel A, Olschewski M, et al. Importance of cardiac troponin I and T in risk stratification of patients with acute pulmonary embolism. Circulation 2002;106:1263-8.
- Scridon T, Scridon C, Skali H. Prognostic significance of troponin elevation and right ventricular enlargement in acute pulmonary embolism. Am J Cardiol 2005;96(2):303-5.
- Meyer T, Binder L, Hruska N, et al. Cardiac troponin I elevation in acute pulmonary embolism is associated with right ventricular dysfunction. J Am Coll Cardiol 2000;36:1632-6.
- Giannitsis E, Muller-Bardorff M, Kurowski V, et al. Independent prognostic value of Cardiac troponin T in patients with confirmed pulmonary embolism. Circulation 2000;102:211-7.
- Pruszczyk P, Bochowicz A, Torbicki A, et al. Cardiac troponin T monitoring identifies high-risk group of normotensive patients with acute pulmonary embolism. Chest 2003;123:1947-52.
- Yalamanchili K, Sukhija R, Aronow WS, et al. Prevalence of increased cardiac Troponin I levels in patients with and without acute pulmonary embolism and relation of increased cardiac troponin I levels with in- hospital mortality in patients with acute pulmonary embolism. Am J Cardiol 2004;93:263-4.
- La Vecchia L, Ottani F, Favero L, et al. Increased cardiac troponin I on admission predicts in-hospital mortality in acute pulmonary embolism. Heart 2004;90:633-7.
- Janata K, Holzer M, Laggner AN, et al. Cardiac troponin T in the Severity assessment of patients with pulmonary embolism: cohort study. Br Med J 2003;326:312-3.
- Qanadli SD, El Hajjam M, et al. New CT index to quantify arterial obstruction in pulmonary embolism: comparison with angiographic index and echocardiography. Am J Roentgenol 2001;176(6):1415-20.
- Uflacker R. Atlas of vascular anatomy: an angiographic approach. 1st ed. Baltimore (Md): Lippencott Williams & Wilkins; 1997.
- Metafratzi ZM, Vassiliou MP, Maglaras GC. Acute pulmonary embolism: correlation of CT pulmonary artery obstruction index with blood gas values. Am J Roentgenol 2006;186:213-9.
- Becattini C, Vedovati MC, Agnelli G. Prognostic value of troponins in acute pulmonary embolism: a meta-analysis. Circulation 2007;116(4): 427-33.
- Kucher N, Goldhaber SZ. Cardiac biomarkers for risk stratification of patients with acute pulmonary embolism. Circulation 2003;108: 2191-4.