
Derivation of the 12-lead electrocardiogram and 3-lead vectorcardiogram
a b s t r a c t
Objective: The cardiac dipolar field is represented by the measured 12-lead electrocardiogram and 3- lead vectorcardiogram (VCG). The objective is to derive the 12-lead ECG and 3-lead VCG from 3 measured leads acquired from only 5 electrodes.
Methods: This is a retrospective blinded study comparing measured and derived ECG and VCG tracings. A nonlinear optimization model was used to synthesize the derived 12-lead ECG and 3-lead derived VCG from leads I, II, and V2. A total of 367 measured 12-lead electrocardiograms and 3-lead vectorcardiograms of varying morphologies were acquired from archived digital ECG databases. All tracings were interpreted by 2 Blinded physician reference standards. The derived vs measured tracings were compared quantitatively using Pearson correlation and root mean square error. Qualitative comparisons were determined by physician percent agreement analysis and adjudication.
Results: The correlations between the measured and derived ECGs and VCGs were high (r = 0.867). No clinically significant differences were noted in 98.1% of cases. Electrocardiographic rate, rhythm, segment, axis, and acute myocardial infarction interpretations showed 100% correlation. Root mean square error compared favorably against other synthesis techniques. Overall percent agreements for the various ECG morphologies were noted to be 98.4% to 100%.
Conclusions: The 12-lead ECG and 3-lead VCG can be derived accurately from 3 measured leads with high quantitative and qualitative correlations. These derived tracings can be acquired instantaneously and displayed in real time from a cardiac rhythm monitor. This will allow for immediate, on-demand, convenient, and cost-effective acquisition and analysis of the 12-lead ECG and 3-lead VCG in areas of acute patient care.
(C) 2013
? Awards: Society of Critical Care Medicine 40th Annual Critical Care Congress, San Diego, CA, January 16, 2011, for which it received the first place research award. Society for Academic Emergency Medicine Annual Scientific Sessions, May 7, 1996, Denver, CO, for which it received first prize as the Best Technology Presentation.
American College of Emergency Physicians Scientific Assembly September 14 to 16, 1992, Seattle, WA, for which it received first prize award for the Best Educational Exhibit.
?? Prior presentations: Concepts in this manuscript have been presented at prior meetings:
The synthesis of normal and infarction electrocardiograms from principal vectors by factor analysis. Schreck DM et al. Presented at the Fourth International Conference on Emergency Medicine, May 9, 1992, Washington, DC.
Mathematical modeling in Electrocardiography (educational exhibit). Schreck DM et al. Presented at the American College of Emergency Physicians Scientific Assembly September 14 to 16, 1992, Seattle, WA. Factor analysis of the electrocardiogram and vectorcardiogram. Schreck DM et al. Presented at the Society of Critical Care Medicine 23rd Scientific Assembly January 31 to February 3, 1994, Orlando, Florida.
Mathematical modeling of the electrocardiogram and vectorcardiogram. Schreck DM et al. Presented at the American College of Emergency Physicians Research Forum March 18 to 19, 1994, San Diego, CA.
Factor analysis of the standard electrocardiogram. Schreck DM. Presented at the Society for Academic Emergency Medicine Annual Scientific Sessions, May 7, 1996, Denver, CO. Prediction of the 19-lead electrocardiogram from 3 lead-vectors using factor analysis. Schreck DM, et al. Presented at the NJ American College of Emergency Physicians Research Forum. Atlantic City, NJ, May 10, 1999.
Prediction of the 19-lead electrocardiogram from 3 lead-vectors using factor analysis. Schreck DM, et al. Presented at the American College of Emergency Physicians Research Forum. Las Vegas, NV, October 10, 1999.
Factor analysis of the 19-lead electrocardiogram. Schreck DM, et al. Presented at the Society of Critical Care Medicine 29th Educational and Scientific Symposium. Orlando, FL, February 11, 2000.
Prediction of the 19-lead electrocardiogram from 3 lead-vectors using factor analysis. Schreck DM, et al. Presented at the 8th International Conference on Emergency Medicine. Boston, MA, May 5, 2000.
Electrocardiogram mathematical modeling using simplex osptimization. Schreck DM, et al. Presented at the American College of Emergency Physicians Research Forum. Philadelphia, PA, October 24, 2000.
0735-6757/$ - see front matter (C) 2013 http://dx.doi.org/10.1016/j.ajem.2013.04.037
The derivation and electrical basis of the 22-lead electrocardiogram: a computer mathematical model. Schreck DM, Brotea C, Shah SP, Viscito MS. Presented at the American College of Emergency Physicians Annual Scientific Sessions, October 16, 2001, Chicago, IL.
Derivation of the 12-lead electrocardiogram using abstract factor analysis and simplex optimization. Schreck DM, Brotea C, Shah SP. Presented at the XXIX International Congress on Electrocardiography, July 5, 2002, Montreal, Canada.
The derivation of the 12-lead ECG from 3 standard leads. Schreck DM, Brotea C, Hutchinson J, Teitelman S. Presented at the National Association of EMS Physicians Annual Scientific Sessions, January 16, 2003, Panama City, FL.
The derived n-lead electrocardiogram. Schreck DM. Presented at the 33rd Critical Care Congress, Society of Critical Care Medicine, February 21, 2004, Orlando, FL. The derived n-lead electrocardiogram. Schreck DM. Presented at the American College of Emergency Physicians Research Forum. Ocotber 18, 2004, San Francisco, CA.
The mathematical modeling and utility of the derived electrocardiogram. Schreck DM. Presented at the American Heart Association Annual Scientific Sessions, November 12, 2005, Dallas, TX.
Mathematical modeling of the derived electrocardiogram. Schreck DM. Presented at the 35th Annual Critical Care Congress, Society of Critical Care Medicine, January 8, 2006, San Francisco, CA.
Mathematical modeling of the electrocardiogram. Schreck DM, et al. Presented at the American College of Emergency Physicians Research Forum. October 15, 2006, New Orleans, LA.
Mathematical modeling and utility of the derived 22-lead electrocardiogram. Schreck DM and Fishberg RD. Presented at the American College of Cardiology Annual Scientific Sessions. April 17, 2011, New Orleans, LA.
The derivation of the 15-lead electrocardiogram and vectorcardiogram. Schreck DM and Fishberg RD. Presented at the Society of Critical Care Medicine 42d Annual Critical
Care Congress. January 20, 2013. San Juan, Puerto Rico.
? Funding sources/disclosures: This study was unfunded.
Dr David M. Schreck owns a significant nonmajority interest in VectraCor that constitutes greater than 5% of the entity. VectraCor is the medical device company that has developed the technology for the derivation of the n-lead electrocardiogram and the cardiac electrical biomarker.
* Corresponding author. Department of Emergency Medicine, Summit medical group, 1 Diamond Hill Road, Berkeley Heights, NJ 07922. Tel.: +1 908 273 4300.
E-mail address: [email protected] (D.M. Schreck).
Introduction
Cardiac electrical activity is reported to be highly dipolar [1,2] and is clinically represented by both the scalar measured 12-lead electrocardiogram (ECG) (mECG) and 3-lead spatial measured vectorcardiogram (VCG) (mVCG) [3]. In theory, if the cardiac electrical field is dipolar, then only 3 measured leads should be necessary to actually derive this composite 15-lead ECG [4] from just 5 body surface electrodes that are connected to a cardiac rhythm monitoring device. This will allow usual and customary continuous cardiac rhythm monitoring with the added simultaneous advantage of acquiring the derived 12-lead ECG (dECG) and scalar 3-lead derived VCG (dVCG), a composite 15-lead ECG, instantaneously and in real time using 1 cardiac rhythm monitoring device.
In patients where cardiac rhythm monitoring, 12-lead ECG, and spatial 3-lead VCG acquisitions are clinically indicated, a total of 17 electrodes must be placed on the body surface as described in Fig. 1. The placement of these 17 electrodes is time consuming and costly, especially when repeat serial ECGs must be acquired. It would be highly desirable to record these 15 scalar ECG leads, along with the corresponding cardiac rhythm data, from a reduced lead set, thereby making the acquisition process more timely and efficient.
The objective of this study is to derive with accuracy the standard 12-lead dECG plus 3-lead dVCG, from just 3 measured leads using 5 body surface electrodes that are a subset of the 12-lead mECG, connected to a new continuous cardiac rhythm monitoring device (VectraplexECG System with VectraplexAMI; VectraCor, Inc, Totowa, NJ) using a nonlinear optimization (NLO) constructed universal patient transformation matrix (UPTM).
Methods
This study is a blinded retrospective observational design comparing the quantitative and qualitative correlations between the mECGs and mVCGs with their corresponding dECG and dVCG tracings. The institutional review board approved this ECG retrospective study methodology and exempted the need for informed consent.
The study was conducted in a community academic teaching hospital. Measured ECGs of various morphologies were obtained from
2 archived patient ECG and VCG databases including (1) the Physiobank [5] Physikalisch-Technische Bundesanstalt database and (2) a database from Muhlenberg Regional Medical Center (Plainfield, NJ). The Muhlenberg Regional Medical Center database includes consecutive patients who were admitted to the emergency department (ED) with chest pain. The standard 12-lead ECGs and 3-lead VCGs were acquired using a Marquette MAC-15 machine
(GE Healthcare, Waukesha, WI). These ECG records were retro- spectively reviewed.
The flow diagram for patient selection is shown in Fig. 2. Electrocardiograms with corresponding VCGs of men and women older than 18 years were studied. Cases were excluded if there was wandering baseline of 5 mm or higher, excessive noise, ECGs repeated on same day, and ECGs with missing leads or lead placement errors. Two independent physician readers, a board-certified emergency physician and board-certified cardiologist, served as the blinded reference standards. The physicians were blinded to (1) the ECG acquisition and signal processing, (2) the patient’s disease state, (3) to each other’s interpretation, and (4) to whether the 12-lead ECG and 3-
lead VCG were measured or derived.
The digitized voltage-time points that comprise the graphic ECG lead tracings were acquired for the 8 measured ECG leads and 3 measured VCG leads. Leads III, aVR, aVL, and aVF are calculated from known geometries in the Einthoven triangle [6] and are redundant. The P-P full cycles (or Q-Q full cycle when the P-P is not available such as in atrial fibrillation) of similar beats in each 10 seconds of voltage-time data are identified and processed yielding a median beat for analysis.
The basis measured 3-lead set (I, II, V2) is used to derive the remaining leads being studied. Leads I, II, and V2 are measured but are not an orthogonal set of lead vectors. However, substituting lead aVF for lead II yields an orthogonal set of leads. Lead aVF can be calculated from leads I and II using accepted geometric formulae [7]. The derived ECG results from the multiplication of the NLO [8] constructed UPTM by the basis 3-lead measured voltage-time data matrix. This UPTM was constructed a priori from an independent set of men and women with variable ECG and VCG morphologies.
The quantitative measures of similarity between the original mECG and mVCG and the corresponding dECG and dVCG were determined using Pearson r correlation [4,9] and root mean square error (RMSE) analysis [10,11] for each derived lead. The Pearson r was considered to show high positive correlation [12] at r >= 0.7. Statistical significance for Pearson r was calculated at ? = .025 (1-tailed, positive correlation only). The RMSE is a parameter that indicates the average voltage error (microvolts) across the ECG leads studied. The RMSE was calculated for comparison with other investigators who have recorded this type of data for derived ECG leads.
Qualitative measures of similarity and reproducibility between the measured and derived ECG and VCG were determined using percent agreement analysis [13] of the interpretations by the blinded physician reference standards.
The primary outcomes were the quantitative correlations of the measured and derived ECG and VCG tracings based on the Pearson r
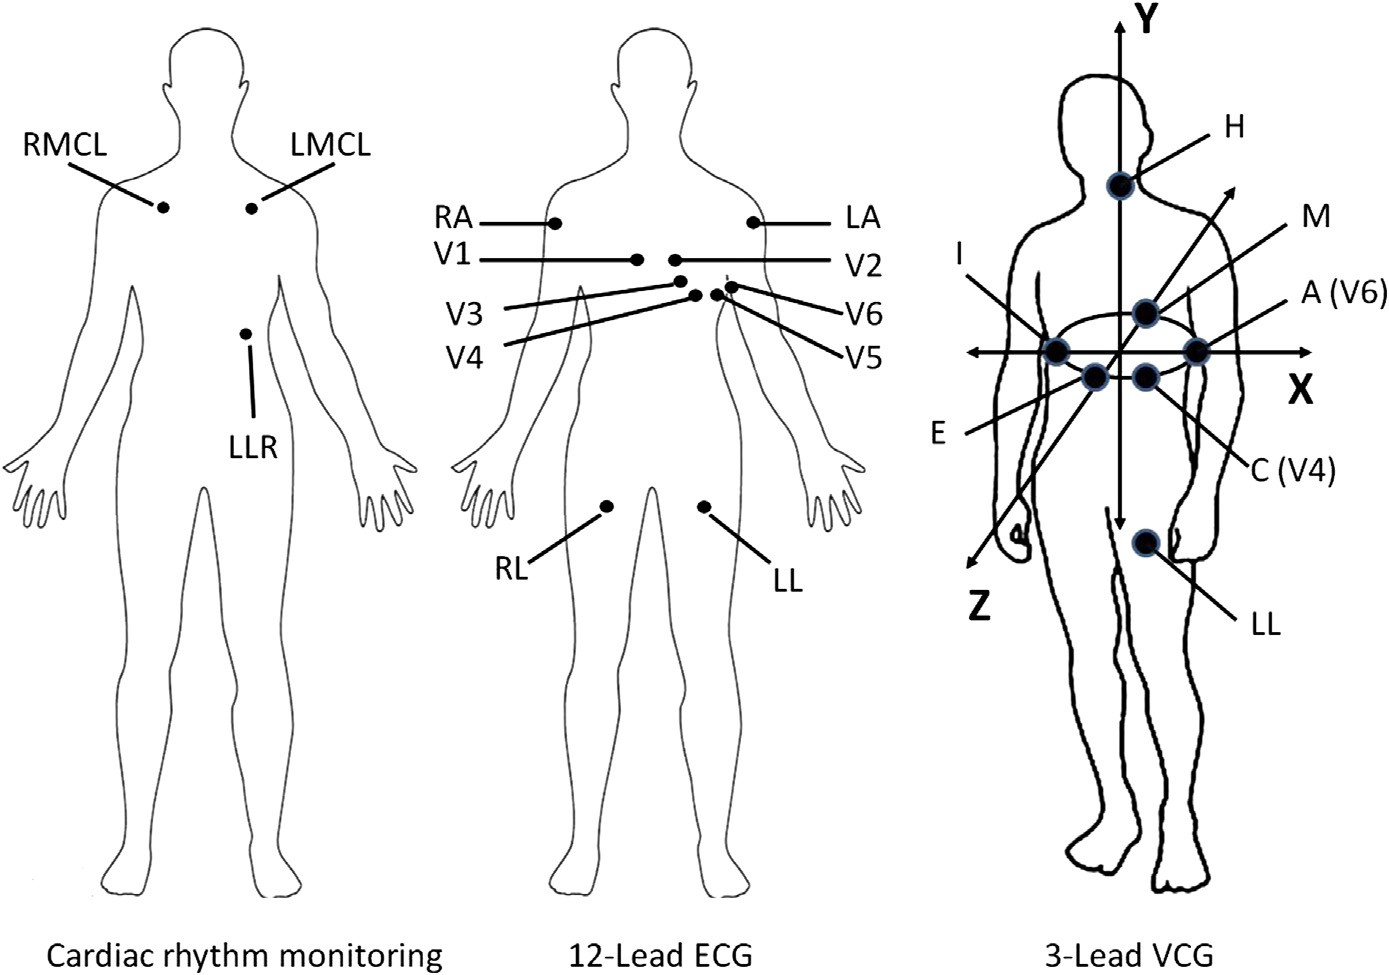
RA = Right upper extremity LA = left upper extremity LL = Left lower extremity
RL = Right lower extremity (Ground)
V1 = Right 4th intercostal space parasternal line V2 = Left 4th intercostals space parasternal line V3 = Midway between V2 and V4
V4 = Left 5th intercostal space midclavicular line V5 = Left 5th intercostal space anterior axillary line V6 = Left 5th intercostal space midaxillary line
I = Right 5th intercostal space midaxillary line
E = 4th intercostal space midsternum process on level with V6 M = Left posterior chest wall paraspinal line on level with V6 H = Left side of neck
RMCL = Anterior chest wall (cardiac monitoring) right 2d intercostal space midclavicular line LMCL = Anterior chest wall (cardiac monitoring) left 2d intercostal space midclavicular line LLR = Anterior chest wall left lower rib cage
Fig. 1. Electrode placement for cardiac rhythm monitoring, 12-lead ECG, and 3-lead VCG acquisition. A total of 17 different electrodes are needed to perform all of these diagnostic tests simultaneously. The VectraplexECG System requires only 5 electrodes (RA, LA, LL, RL, V2) to perform these same tests.
correlation and RMSE statistics described above and the qualitative methods based on blinded physician percent agreement methodol- ogy. Statistical analyses were performed using Statistica (version 10.0; StatSoft, Tulsa, OK).
Results
A total of 367 cases were enrolled in this study. Table 1 describes the characteristics of the study subject ECGs. One case of situs inversus that was found after patient selection was excluded from the statistical analyses.
Table 2 describes the Pearson r correlation analysis for a variety of different morphologic ECGs using the NLO method. It should be emphasized that the correlation is only performed on the derived leads. Leads I, II, and V2 are not analyzed because they comprise the measured lead set from which all derivations are constructed and have no error. This is an advantage because these leads are a subset of the 12-lead ECG. As such, additional education on an unfamiliar basis lead set is not required. In addition, the accuracy of the placement of the electrodes for these leads has minimal error. All NLO-synthesized limb leads showed perfect correlations (r = 1.00) suggesting the UPTM should have high accuracy in synthesizing the remaining derived leads. Pearson r for the 12-lead ECG showed high correlations
(r = 0.867) for all cases. In addition, all subtype ECG morphologies demonstrated high correlations ranging from 0.823 to 0.913. These correlations compare favorably [4,9] to the EASI methodology originally described by Dower [14] for the dECG (n = 117; r = 0.854). All derived leads independently show good correlation with the corresponding measured leads across all cases. All correlations were statistically significant at P b 0.001.
Table 3 describes the Pearson r correlations for the derived leads at specific points in the ECG and VCG waveforms. All correlations were statistically significant at each portion of the ECG cycle at P b 0.001.
Fig. 3 describes the RMSE analysis for the NLO 12-lead dECG derivation method used by the VectraplexECG System compared with the derivation methods used by the EASI [10] and Mason-Likar [11] methods. It is shown that the NLO method compares favorably to these methods. It is important to note that there is essentially no error in 7 leads (I, II, III, aVR, aVL, aVF, and V2) using the NLO method. This is due to the NLO method using leads I, II, and V2 as the basis measured lead set from which all other leads are derived. The other methods do not use this advantage. Table 4 describes the RMSE of the derived vs measured leads at specific regions of the ECG and VCG waveforms.
Percent agreement analysis for the blinded physician reference standards interpretation agreements is shown in Tables 5 and 6. The consensus Interobserver agreement for both blinded physician


Age < 18 Wandering baseline Missing leads Noise
Duplicate ECGs same day Lead placement error
Cases used to construct UPTM
549
94
PTBDB: MRMC:
Total cases assessed for eligibility (n = 643)
After Primary Exclusions: 472
Used for separate study (n = 105) MRMC: 28, PTBDB: 77
TEST SET: 367 cases MRMC: 46 cases
PTBDB: 321 cases
PTBDB = Physikalisch-Technische Bundesanstalt database MRMC = Muhlenberg Regional Medical Center database ECG = Electrocardiogram
Cardiology: 367
Adjudication: 367
EP: 367
UPTM = Universal patient transformation matrix EP = Emergency physician
Fig. 2. Flow diagram for selection of patients.
reference standards reached by adjudication also showed high agreement in diagnostic accuracy between the mECG and dECG as shown in Table 5. The cardiologist intraobserver agreement between the mECG and dECG for various ECG morphologic conditions demonstrates high agreement in diagnostic accuracy between the mECG and dECG as shown in Table 6. The EP intraobserver agreement between the mECG and dECG for various ECG morphologic conditions also demonstrates high agreement in diagnostic accuracy between the mECG and dECG as shown in Table 6.
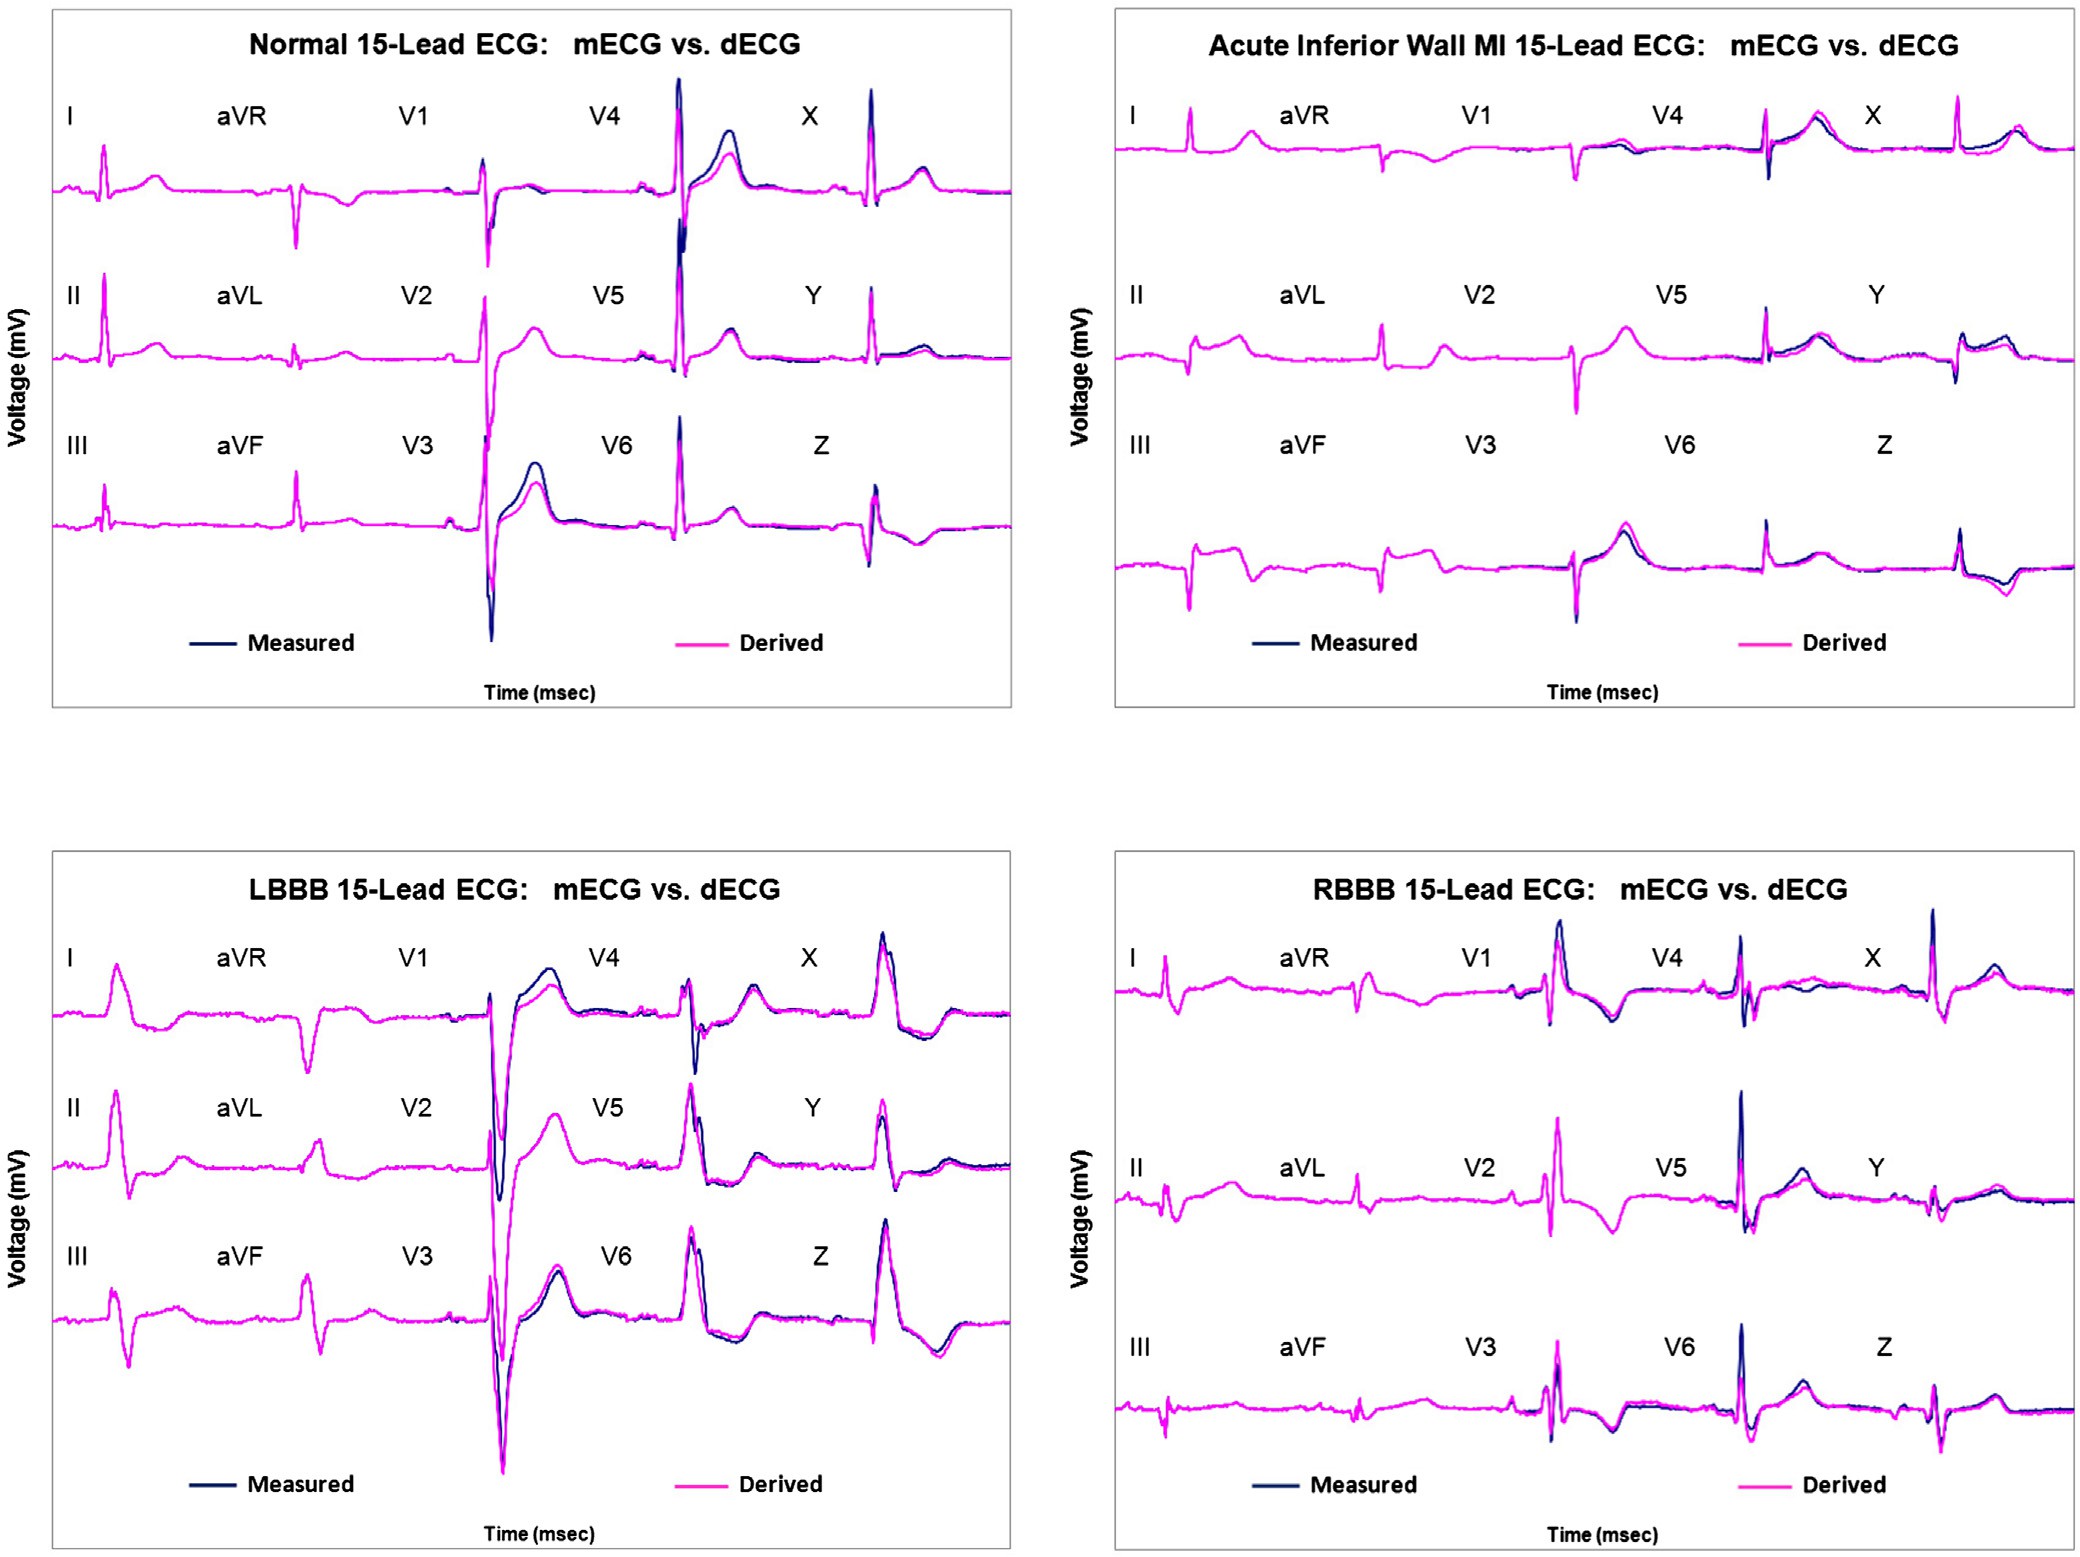
Fig. 4A-4D show comparisons of the scalar mECGs and mVCGs with the corresponding dECGs and dVCGs for several clinical states.
Characteristics of the test set
Test set
n 366
Male, % 71.4%
Median age (all) 55.8 +- 14.4
Median age (male) 54.2 +- 13.5
Median age (female) 59.8 +- 15.8
AMI 124
Control/non-AMI 243
LBBB 19
RBBB 16
LAFB 26
IRBBB 21
IVCD 41
PVC 11
Paced rhythm 4
NSSTT changes 84
LVH 35
Abbreviations: AMI, acute myocardial infarction; LBBB, Left bundle-branch block; RBBB, right bundle-branch block; LAFB, left anterior fascicular block; IRBBB, incomplete right bundle-branch block; IVCD, intraventricular conduction delay; PVC, premature ventricular contraction; NSSTT, nonspecific ST-T wave changes; LVH, left ventricular hypertrophy.
Discussion
This is the first study describing the process for synthesizing the dECG and dVCG from just 3 measured leads that are a subset of the standard 12-lead ECG, using an NLO technique. The concept of the dECG has been previously reported [15-19]. Schreck et al [20] reported that factor analysis [21] demonstrated that the 12-lead ECG can be derived from just 3 measured lead vectors using a “patient- specific” transformation matrix. However, Schreck et al [22] subsequently demonstrated that a “universal patient” transforma- tion matrix can be computed using an NLO technique that can be used to derive the 12-lead ECG independent of sex, race, age, body habitus, and timing, thus eliminating the need for constructing a patient-specific transformation matrix for each patient. The NLO- constructed UPTM allows a “one-size-fits-all” approach to using only 1 UPTM for all patients at any time to derive any patient 12-lead ECG and 3-lead VCG.
The EASI system uses a nonstandard 3 measured lead system to derive the 12-lead ECG, but there is inherent electrode placement variability in all leads. In comparison, the device used in this study uses 3 measured leads, with the least lead placement variability (limb leads and V2), which are a subset of the standard 12-lead ECG and are well known and understood.
The spatial 3-lead VCG was reported by Frank [23] over 50 years ago, and its clinical value has been reported in numerous publications and textbooks [24-28]. In addition, the VCG has been reported to be more sensitive [29-32] in the diagnosis of cardiac pathology, but it is becoming a lost art due to lack of readily available machinery and lack of education of this technology. The detailed concepts of VCG recording and interpretation currently are not typically a standard part of any medical school training or fellowship curriculum. It would be clinically advantageous in Acute care settings to implement the VCG concepts to enhance diagnostic capabilities if the acquisition of the VCG could be accomplished
Pearson r correlation for various 12-lead ECG morphologies
|
Pearson r |
n |
III |
aVR |
aVL |
aVF |
V1 |
V2a |
V3 |
V4 |
V5 |
V6 |
12-lead ECG |
95% CI |
||
|
All cases |
366 |
N/A |
N/A |
1.00 |
1.00 |
1.00 |
1.00 |
0.87 |
N/A |
0.90 |
0.71 |
0.71 |
0.75 |
0.867 |
0.010 |
|
AMI |
124 |
N/A |
N/A |
1.00 |
1.00 |
1.00 |
1.00 |
0.84 |
N/A |
0.88 |
0.62 |
0.66 |
0.68 |
0.855 |
0.017 |
|
Anteroseptal |
39 |
N/A |
N/A |
1.00 |
1.00 |
1.00 |
1.00 |
0.89 |
N/A |
0.90 |
068 |
.068 |
0.75 |
0.889 |
0.018 |
|
Inferior |
46 |
N/A |
N/A |
1.00 |
1.00 |
1.00 |
1.00 |
0.78 |
N/A |
0.85 |
0.56 |
0.68 |
0.66 |
0.842 |
0.033 |
|
Lateral |
21 |
N/A |
N/A |
1.00 |
1.00 |
1.00 |
1.00 |
0.84 |
N/A |
0.86 |
0.62 |
0.53 |
0.60 |
0.808 |
0.045 |
|
Posterior |
21 |
N/A |
N/A |
1.00 |
1.00 |
1.00 |
1.00 |
0.78 |
N/A |
0.83 |
0.60 |
0.58 |
0.49 |
0.809 |
0.056 |
|
Non-STEMI/ischemia |
63 |
N/A |
N/A |
1.00 |
1.00 |
1.00 |
1.00 |
0.86 |
N/A |
0.88 |
0.57 |
0.65 |
0.67 |
0.847 |
0.024 |
|
Prior MI (recent or old) |
133 |
N/A |
N/A |
1.00 |
1.00 |
1.00 |
1.00 |
0.87 |
N/A |
0.90 |
0.64 |
0.63 |
0.65 |
0.846 |
0.016 |
|
Control/non-AMI |
243 |
N/A |
N/A |
1.00 |
1.00 |
1.00 |
1.00 |
0.89 |
N/A |
0.91 |
0.75 |
0.74 |
0.78 |
0.873 |
0.012 |
|
LBBB |
19 |
N/A |
N/A |
1.00 |
1.00 |
1.00 |
1.00 |
0.91 |
N/A |
0.94 |
0.53 |
0.52 |
0.81 |
0.881 |
0.032 |
|
RBBB |
16 |
N/A |
N/A |
1.00 |
1.00 |
1.00 |
1.00 |
0.72 |
N/A |
0.81 |
0.59 |
0.66 |
0.69 |
0.852 |
0.042 |
|
LAFB |
26 |
N/A |
N/A |
1.00 |
1.00 |
1.00 |
1.00 |
0.81 |
N/A |
0.88 |
0.64 |
0.46 |
0.54 |
0.850 |
0.032 |
|
IRBBB |
21 |
N/A |
N/A |
1.00 |
1.00 |
1.00 |
1.00 |
0.62 |
N/A |
0.89 |
0.85 |
0.81 |
0.76 |
0.869 |
0.043 |
|
IVCD |
41 |
N/A |
N/A |
1.00 |
1.00 |
1.00 |
1.00 |
0.79 |
N/A |
0.88 |
0.56 |
0.58 |
0.74 |
0.866 |
0.026 |
|
PVC |
11 |
N/A |
N/A |
1.00 |
1.00 |
1.00 |
1.00 |
0.86 |
N/A |
0.92 |
0.74 |
0.69 |
0.65 |
0.845 |
0.084 |
|
Paced rhythm |
4 |
N/A |
N/A |
1.00 |
1.00 |
1.00 |
1.00 |
0.80 |
N/A |
0.89 |
0.74 |
0.49 |
0.79 |
0.913 |
0.009 |
|
NSSTT changes |
84 |
N/A |
N/A |
1.00 |
1.00 |
1.00 |
1.00 |
0.88 |
N/A |
0.90 |
0.70 |
0.69 |
0.78 |
0.857 |
0.022 |
|
LVH |
35 |
N/A |
N/A |
1.00 |
1.00 |
1.00 |
1.00 |
0.96 |
N/A |
0.88 |
0.68 |
0.80 |
0.89 |
0.891 |
0.021 |
Abbreviations: N/A, Not applicable; CI, confidence interval; STEMI, ST-elevation myocardial infarction.
a Leads I, II, and V2 are the measured lead set from which the derived ECG is constructed and have no error.
Table 3
Pearson r correlation of measured vs derived leads V1, V3, V4, V5, V6, X, Y, and Z at specific waveform peak voltages (P, Q, R, S, J, ST20, ST60, ST80, T+, T-)
|
V1 |
V3 |
V4 |
V5 |
V6 |
X |
Y |
Z |
|
|
mP vs dP |
0.41 |
0.73 |
0.71 |
0.73 |
0.75 |
0.84 |
0.92 |
0.57 |
|
mQ vs dQ |
0.69 |
0.66 |
0.76 |
0.78 |
0.80 |
0.81 |
0.93 |
0.84 |
|
mR vs dR |
0.79 |
0.82 |
0.63 |
0.64 |
0.73 |
0.68 |
0.88 |
0.74 |
|
mS vs dS |
0.69 |
0.75 |
0.62 |
0.60 |
0.72 |
0.80 |
0.88 |
0.76 |
|
mJ vs dJ |
0.86 |
0.83 |
0.71 |
0.71 |
0.75 |
0.88 |
0.92 |
0.81 |
|
mST20 vs dST20 |
0.89 |
0.89 |
0.73 |
0.71 |
0.77 |
0.85 |
0.92 |
0.81 |
|
mST60 vs dST60 |
0.90 |
0.90 |
0.73 |
0.74 |
0.80 |
0.84 |
0.88 |
0.83 |
|
mST80 vs dST80 |
0.89 |
0.90 |
0.73 |
0.75 |
0.81 |
0.86 |
0.92 |
0.83 |
|
mT+ vs dT+ |
0.81 |
0.88 |
0.76 |
0.78 |
0.86 |
0.85 |
0.91 |
0.89 |
|
mT- vs dT- |
0.79 |
0.89 |
0.83 |
0.72 |
0.73 |
0.77 |
0.94 |
0.83 |
Abbreviations: m(P, Q, R, S, T+, T-), measured (P, Q, R, S,T+, T-) waves; d(P, Q, R, S, T+, T-), derived (P, Q, R, S, T+, T-) waves; mJ, measured J point; dJ, derived J point; mST20, measured ST voltage 20 milliseconds after J point; dST20, derived ST voltage 20 milliseconds after J point; mST60, measured ST voltage 60 milliseconds after J point; dST60, derived ST voltage 60 milliseconds after J point; mST80, measured ST voltage 80 milliseconds after J point; dST80, derived ST voltage 80 milliseconds after J point; T+, peak positive T-wave; T-, peak negative T-wave.


V1
M L
150.00
aVL
aVR
I
100.00
50.00
0.00
NLO
EASI
aVF
II
V4
200.00
III
V2
250.00
V5
V3
V6
300.00
RMSE (uV)
RMSE = Root mean square error
I
I
I
I
I
I
uV = Microvolt
NLO = Non-linear optimization
M-L = Mason-Likar
Fig. 3. Comparison of RMSE +- SD for NLO 12-lead ECG derivation method vs the reported EASI and Mason-Likar methods for the different leads of the 12-lead ECG.
Root mean square error (microvolts) +- SD of measured vs derived leads V1, V3, V4, V5, V6, X, Y, and Z at specific waveform peak voltages (P, Q, R, S, J, ST20, ST60, ST80, T+, T-)
|
V1 |
V3 |
V4 |
V5 |
V6 |
X |
Y |
Z |
|
|
P |
50.7 +- 3.0 |
76.1 +- 4.3 |
118.4 +- 5.8 |
102.9 +- 5.2 |
69.1 +- 3.9 |
62.8 +- 3.4 |
30.5 +- 2.2 |
28.4 +- 2.1 |
|
Q |
418.7 +- 45.5 |
420.5 +- 59.2 |
194.8 +- 23.0 |
84.5 +- 13.0 |
57.0 +- 8.0 |
78.4 +- 12.2 |
58.3 +- 7.3 |
150.7 +- 12.0 |
|
R |
128.1 +- 12.6 |
333.0 +- 32.8 |
667.9 +- 59.4 |
569.7 +- 44.4 |
382.9 +- 31.0 |
415.1 +- 28.4 |
205.5 +- 20.4 |
352.4 +- 24.8 |
|
S |
447.2 +- 42.6 |
504.0 +- 52.1 |
590.7 +- 49.2 |
344.3 +- 35.0 |
109.6 +- 11.3 |
125.5 +- 14.2 |
108.3 +- 12.9 |
132.8 +- 18.2 |
|
J |
32.0 +- 2.7 |
76.2 +- 7.0 |
84.8 +- 7.3 |
62.5 +- 5.7 |
42.3 +- 4.4 |
37.3 +- 3.4 |
25.2 +- 2.2 |
43.1 +- 3.2 |
|
ST20 |
31.4 +- 2.7 |
61.9 +- 6.4 |
83.4 +- 8.0 |
61.8 +- 6.2 |
41.3 +- 4.4 |
38.7 +- 3.5 |
26.2 +- 2.4 |
43.0 +- 3.5 |
|
ST60 |
39.1 +- 3.4 |
74.5 +- 6.8 |
102.8 +- 10.8 |
76.0 +- 8.9 |
47.1 +- 4.9 |
46.6 +- 4.0 |
32.1 +- 3.1 |
52.7 +- 4.1 |
|
ST80 |
46.9 +- 4.2 |
84.2 +- 6.9 |
114.4 +- 12.3 |
86.2 +- 11.1 |
50.9 +- 5.5 |
50.1 +- 4.2 |
36.6 +- 3.6 |
63.3 +- 4.9 |
|
T+ |
93.7 +- 9.3 |
191.6 +- 13.2 |
216.5 +- 16.9 |
154.8 +- 13.2 |
84.6 +- 6.0 |
119.5 +- 9.4 |
65.1 +- 4.7 |
32.3 +- 3.3 |
|
T- |
52.9 +- 4.5 |
74.5 +- 7.9 |
127.4 +- 14.2 |
100.2 +- 10.7 |
63.0 +- 6.3 |
74.0 +- 9.3 |
38.9 +- 5.3 |
148.3 +- 10.4 |
Abbreviations: ST20, ST voltage 20 milliseconds after J point; ST20, ST voltage 20 milliseconds after J point; ST20, ST voltage 20 milliseconds after J point; T+, peak positive T-wave voltage; T-, peak negative T-wave voltage.
Table 5
Consensus adjudication (EP and cardiologist) percent agreement between mECG and dECG for various morphologies
|
Condition |
n |
Consensus adjudication mECG vs dECG |
|||
|
OA (%) (95% CI) |
PPA (%) (95% CI) |
PNA (%) (95% CI) |
|||
|
First-degree AV block |
57 |
100 (99.1, 99.9) |
100 (93.7, 100) |
100 (98.8, 100) |
|
|
Atrial fibrillation |
18 |
100 (99.1, 99.9) |
100 (82.4, 100) |
100 (98.9, 100) |
|
|
Acute MI |
124 |
99.7 (98.7, 99.7) |
99.2 (95.6, 99.9) |
100 (98.4, 100) |
|
|
Arrhythmia |
97 |
100 (99.1, 99.9) |
100 (96.2, 100) |
100 (98.6, 100) |
|
|
Bradycardia |
58 |
100 (99.1, 99.9) |
100 (93.8, 100) |
100 (98.6, 100) |
|
|
Early repolarization |
28 |
100 (99.1, 99.9) |
100 (87.9, 100) |
100 (98.9, 100) |
|
|
IRBBB |
21 |
99.2 (97.9, 99.4) |
85.7 (65.4, 95.0) |
100 (98.8, 100) |
|
|
IVCD |
41 |
100 (99.1, 99.9) |
100 (90.6, 100) |
100 (98.8, 100) |
|
|
LAD |
37 |
100 (99.1. 99.9) |
100 (90.6, 100) |
100 (98.8, 100) |
|
|
LAE |
120 |
99.7 (98.7, 99.7) |
99.2 (95.4, 99.9) |
100 (98.5, 100) |
|
|
LAFB |
26 |
100 (99.1, 99.9) |
100 (87.1, 100) |
100 (98.9, 100) |
|
|
LBBB |
19 |
100 (99.1, 99.9) |
100 (83.2, 100) |
100 (98.9, 100) |
|
|
LVH |
35 |
99.7 (98.7, 99.7) |
100 (85.5, 99.5) |
99.7 (98.9, 100) |
|
|
Normal axis |
323 |
100 (99.1, 99.9) |
100 (98.8, 100) |
100 (91.8, 100) |
|
|
NSR |
266 |
100 (99.1, 99.9) |
100 (98.6, 100) |
100 (96.3, 100) |
|
|
NSSTT |
84 |
100 (99.1, 99.9) |
100 (95.6, 100) |
100 (98.7, 100) |
|
|
NSTEMI |
40 |
99.5 (98.3, 99.6) |
95.0 (83.5, 98.6) |
100 (98.8, 100) |
|
|
Paced rhythm |
4 |
100 (99.1, 99.9) |
100 (51.0, 100) |
100 (99.0, 100) |
|
|
PVC |
11 |
100 (99.1, 99.9) |
100 (74.1, 100) |
100 (99.0, 100) |
|
|
RAD |
6 |
100 (99.1, 99.9) |
100 (61.0, 100) |
100 (98.9, 100) |
|
|
RBBB |
16 |
100 (99.1, 99.9) |
100 (80.6, 100) |
100 (98.9, 100) |
|
|
RVH |
6 |
99.7 (98.7, 99.7) |
83.3 (43.6, 97.0) |
100 (98.9, 100) |
|
|
STEMI |
84 |
99.7 (98.7, 99.7) |
98.8 (93.6, 99.8) |
100 (98.7, 100) |
|
|
Tachycardia |
22 |
100 (99.1, 99.9) |
100 (85.1, 100) |
100 (98.9, 100) |
|
|
Prior MI |
133 |
100 (99.1, 99.9) |
100 (97.2, 100) |
100 (98.4, 100) |
|
Abbreviations: LAE, left atrial enlargement; OA, overall agreement; PPA, percent positive agreement; NSR, normal sinus rhythm; PNA, percent negative agreement; AV, atrioventricular; NSTEMI, Non-ST-segment elevation myocardial infarction; MI, myocardial infarction; RAD, Right axis deviation; RVH, Right ventricular hypertrophy; LAD, left axis deviation.
Emergency physician and cardiologist percent agreement between mECG and dECG for various morphologies
Condition n Cardiologist dECG vs mECG EP dECG vs mECG
|
OA (%) (95% CI) |
PPA (%) (95% CI) |
PNA (%) (95% CI) |
OA (%) (95% CI) |
PPA (%) (95% CI) |
PNA (%) (95% CI) |
||||
|
First-degree AV block |
57 |
100 (99.1, 99.9) |
100 (93.7, 100) |
100 (98.8, 100) |
100 (99.1, 99.9) |
100 (93.7, 100) |
100 (98.8, 100) |
||
|
Atrial fibrillation |
18 |
100 (99.1, 99.9) |
100 (82.4, 100) |
100 (98.9, 100) |
100 (99.1, 99.9) |
100 (82.4, 100) |
100 (98.9, 100) |
||
|
Acute MI |
124 |
98.9 (97.6,99.2) |
96.7 (90.8, 98.9) |
99.6 (98.0, 99.9) |
100 (99.1, 99.9) |
100 (96.9, 100) |
100 (98.5, 100) |
||
|
Arrhythmia |
97 |
100 (99.1, 99.9) |
100 (96.2, 100) |
100 (98.6, 100) |
100 (99.1, 99.9) |
100 (96.2, 100) |
100 (98.5, 100) |
||
|
Bradycardia |
58 |
100 (99.1, 99.9) |
100 (93.8, 100) |
100 (98.8, 100) |
100 (99.1, 99.9) |
100 (93.8, 100) |
100 (98.8, 100) |
||
|
Early repolarization |
28 |
100 (99.1, 99.9) |
100 (87.5, 100) |
100 (98.9,100) |
100 (99.1, 99.9) |
100 (87.5, 100) |
100 (98.9, 100) |
||
|
IRBBB |
21 |
100 (99.1, 99.9) |
100 (56.6, 100) |
100 (98.8, 100) |
99.2 (97.9, 99.4) |
85.7 (65.4, 95.0) |
100 (98.9, 100) |
||
|
IVCD |
41 |
100 (99.1, 99.9) |
100 (90.6, 100) |
100 (92.3, 100) |
100 (98.8, 100) |
100 (98.8, 100) |
100 (98.6, 100) |
||
|
LAD |
37 |
100 (99.1, 99.9) |
100 (90.6, 100) |
100 (98.8, 100) |
100 (99.1. 99.9) |
100 (90.6, 100) |
100 (98.8, 100) |
||
|
LAE |
120 |
99.7 (98.7, 99.7) |
98.6 (92.5, 99.8) |
100 (98.7, 100) |
99.7 (98.7, 99.7) |
98.6 (92.5, 99.8) |
100 (98.7, 100) |
||
|
LAFB |
26 |
99.7 (98.7, 99.7) |
88.9 (59.6, 98.2) |
100 (98.9, 100) |
100 (99.1, 99.9) |
100 (88.6, 100) |
100 (98.9, 100) |
||
|
LBBB |
19 |
100 (99.1, 99.9) |
100 (83.2, 100) |
100 (98.9, 100) |
100 (99.1, 99.9) |
100 (83.2, 100) |
100 (98.9, 100) |
||
|
LVH |
35 |
99.7 (98.7, 99.7) |
97.1 (85.1, 99.5) |
100 (98.9, 100) |
99.7 (98.7, 99.7) |
96.3 (81.7, 99.3) |
100 (98.9, 100) |
||
|
Normal axis |
323 |
100 (99.1, 99.9) |
100 (98.8, 100) |
100 (91.8, 100) |
100 (99.1, 99.9) |
100 (98.8, 100) |
100 (91.8, 100) |
||
|
NSR |
266 |
100 (99.1, 99.9) |
100 (98.6, 100) |
100 (96.3, 100) |
100 (99.1, 99.9) |
100 (98.6, 100) |
100 (96.3, 100) |
||
|
NSSTT |
84 |
100 (99.1, 99.9) |
100 (95.7, 100) |
100 (98.6, 100) |
100 (99.1, 99.9) |
100 (95.1, 100) |
100 (98.7, 100) |
||
|
NSTEMI |
40 |
99.7 (98.7, 99.7) |
94.1 (73.0, 100) |
100 (98.8, 100) |
100 (99.1, 99.9) |
100 (79.6, 100) |
100 (98.9, 100) |
||
|
Paced rhythm |
4 |
100 (99.1, 99.9) |
100 (51.0, 100) |
100 (99.0, 100) |
100 (99.1, 99.9) |
100 (51.0, 100) |
100 (99.0, 100) |
||
|
PVC |
11 |
100 (99.1, 99.9) |
100 (74.1, 100) |
100 (99.0, 100) |
100 (99.1, 99.9) |
100 (74.1, 100) |
100 (98.9, 100) |
||
|
RAD |
6 |
100 (99.1, 99.9) |
100 (61.0, 100) |
100 (98.9, 100) |
100 (99.1, 99.9) |
100 (61.0, 100) |
100 (98.9, 100) |
||
|
RBBB |
16 |
100 (99.1, 99.9) |
100 (79.6, 100) |
100 (98.9, 100) |
100 (99.1, 99.9) |
100 (80.6, 100) |
100 (98.9, 100) |
||
|
RVH |
6 |
100 (99.1, 99.9) |
100 (34.2, 100) |
100 (99.0, 100) |
99.7 (98.7, 99.7) |
66.7 (20.8, 93.9) |
100 (99.0, 100) |
||
|
STEMI |
84 |
99.7 (98.7, 99.7) |
98.7 (92.8, 99.8) |
100 (98.7, 100) |
99.7 (98.7, 99.7) |
99.0 (94.8, 99.8) |
100 (98.6, 100) |
||
|
Tachycardia |
22 |
100 (99.1, 99.9) |
100 (85.1, 100) |
100 (98.9, 100) |
100 (99.1, 99.9) |
100 (85.1, 100) |
100 (98.9, 100) |
||
|
Prior MI |
133 |
100 (99.1, 99.9) |
100 (97.3, 100) |
100 (98.4, 100) |
100 (99.1, 100) |
100 (96.8, 100) |
100 (98.5, 100) |
||
A
B
Normal 15-Lead ECG:
mECG (blue) vs. dECG (red)
Acute inferior wall STEMI:
mECG (blue) vs. dECG (red)
C D
|
LBBB 15-Lead ECG: |
RBBB 15-Lead ECG: |
|
|
mECG (blue) vs. dECG (red) |
mECG (blue) vs. dECG (red) |
|
|
ECG |
= Electrocardiogram |
|
|
mECG |
= Measured 15-lead ECG (12-lead ECG plus 3-lead Vectrocardiogram) |
|
|
dECG |
= Derived 15-lead ECG |
|
|
MI |
= Myocardial infarction |
|
|
STEMI |
= ST elevation MI |
|
|
LBBB |
||
|
RBBB |
Fig. 4. A, Normal 15-lead ECG: mECG (blue) vs dECG (red). B, Acute inferior wall ST-elevation myocardial infarction: mECG (blue) vs dECG (red). C, Left bundle-branch block 15-lead ECG: mECG (blue) vs dECG (red). D, Right bundle-branch block 15-Lead ECG: mECG (blue) vs dECG (red). MI, myocardial infarction; STEMI, ST-elevation MI; LBBB, left bundle- branch block; RBBB, right bundle-branch block.
through an accurate derivation process directly from a standard cardiac rhythm monitor.
The clinical application of this research will be advantageous in areas of acute care such as the ED, intensive care unit, coronary care unit, operating room, and other areas where cardiac rhythm monitoring and telemetry are provided. The ability to derive a standard 12-lead ECG and spatial 3-lead VCG directly from a standard cardiac rhythm monitor using only 5 electrodes will make the acquisition of these tests much faster, less costly, more easily accessible, and more efficient if clinical accuracy can be demonstrated between the measured and derived ECG and VCG tracings.
The main limitation of this study is its retrospective design. As such, several sources of bias may be present. Random error and spectrum bias were addressed by using multiple known broad-based databases with a large range of ECG morphologies that have been used
by multiple investigators in prior studies. Selection bias was addressed by adhering to the sample size estimates and enrolling all consecutive patient ECGs from the databases.
Another limitation in this study is that the physician reference standards, although blinded, are an imperfect “truth.” Reference standard bias was minimized by blinding the ECG expert readers to each case and to each other regarding their interpretations.
In addition, the mECG by itself is also an imperfect truth in that electrode placement variability is very high for the chest leads [33]. Thus, any comparison of the dECG (which uses an electrode set with minimal placement error) to the mECG must beg the question “which one is correct?”
One more limitation of this study is that a direct comparison of the NLO method to EASI method of ECG derivation was not performed. Published data have been reported, but a direct comparative study is necessary to draw any statistical conclusions.
The results of this study demonstrate that the dECG and derived spatial 3-lead VCG using the NLO methodology have high correlation with the corresponding measured scalar leads based on quantitative and qualitative comparisons. This derived composite 15-lead ECG can be constructed from just 3 acquired leads using 5 body surface electrodes connected to a cardiac rhythm monitor. These derived 15 scalar ECG leads are obtained in real-time or on demand directly from the cardiac rhythm monitor. This minimizes the need to obtain frequent serial measured ECGs requiring staff time and numerous electrodes. Application of this device will be advantageous in acute care settings by identifying potential ECG morphology changes in real time in a more convenient and efficient manner.
Acknowledgments
The authors acknowledge the Atlantic Health System Overlook Medical Center library staff for their assistance in the extensive literature searching required for the preparation of this manuscript.
References
- Geselowitz DB. Dipole theory in electrocardiography. Am J Cardiol 1964;14:301-6.
- Gabor D, Nelson CV. Determination of the resultant dipole of the heart from measurements on the body surface. J Appl Phys 1954;25:413-6.
- Malmivuo J, Plonsey R. 12-Lead ECG system. In: Malmivuo J, Plonsey R, editors. Bioelectromagnetism: principles and applications of bioelectric and biomagnetic fields. London: Oxford University Press; 1995. p. 277-89.
- Nelwan SP, Kors JA, Meij SH, et al. Reconstruction of the 12-lead electrocardiogram from reduced lead sets. J Electrocardiol 2004;37:11-8.
- Goldberger AL, Amaral LAN, Glass L, et al. PhysioBank, PhysioToolkit, and PhysioNet: components of a new research resource for complex physiologic signals. Circulation 2000;101:e215-20.
- Frank E. General theory of heart-vector projection. Circ Res 1954;2:258-70.
- Goldman MJ. Introduction to electrocardiography. In: Goldman MJ, editor. Principles of clinical electrocardiography. Eighth Edition. Los Altos: Lange Medical Publications; 1973. p. 13-4.
- Shavers CL, Parsons ML, Deming SN. Simplex optimization of chemical systems. J Chemical Education 1979;56:307-9.
- Chantad D, Krittayaphong R, Komoltri C. Derived 12-lead electrocardiogram in the assessment of ST-segment deviation and cardiac rhythm. J Electrocardiol 2006;39: 7-12.
- Nelwan SP, Crater SW, Meij SH, et al. Simultaneous comparison of three derived 12-lead ECGs with Standard ECG at rest and during percutaneous coronary occlusion. J Electrocardiol 2008;41:230-7.
- Drew BJ, Dempsey ED, Joo TH, et al. Pre-hospital synthesized 12-lead ECG ischemia monitoring with trans-telephonic transmission in acute coronary
syndromes: pilot study results of the ST SMART trial. J Electrocardiol 2004; 37(Suppl):214-21.
Munro BH. Correlation. In: Munro BH, editor. Statistical methods for healthcare research. Fifth Edition. Philadelphia: Lippincott Williams & Wilkins; 2005.
Clinical and Laboratory Standards Institute document EP12-A2: User Protocol for Evaluation of Qualitative Test Performance: Approved Guideline. Second Edition. Wayne, Pennsylvania, 2008.
- Dower GE, et al. Deriving the 12-lead electrocardiogram from four (EASI) electrodes. J Electrocardiol 1988;21:182.
- Scher AM, Young AC, Meredith WM. Factor analysis of the electrocardiogram. Test of electrocardiographic theory: normal hearts. Circ Res 1960;8:519-26.
- Man SC, Maan AC, Kim E, et al. Reconstruction of standard 12-lead electrocardio- grams from 12-lead electrocardiograms recorded with the Mason-Likar electrode configuration. J Electrocardiol 2008;41:211-9.
- Horacek BM, Warren JW, Wang JJ. On designing and testing transformations and derivation of standard 12-lead/18-lead electrocardiograms and vectorcardio- grams from reduced sets of predictor leads. J Electrocardiol 2008;41:220-9.
- Nelwan SP, Carey MG. Reduced and alternative lead sets: clinical and technical challenges. J Electrocardiol 2008;41:451-3.
- Scherer JA, Jenkins JM, Nicklas JM. Synthesis of the12-lead electrocardiogram from a 3 lead subset using patient-specific transformation vectors: an algorithmic approach to computerized signal synthesis. J Electrocardiol 1989;22:128.
- Schreck DM, Tricarico VJ, Frank JD, et al. Statistical methodology: VI. Mathematical modeling of the electrocardiogram using factor analysis. Acad Emerg Med 1998;5: 929-34.
- Malinowski ER. Factor analysis in chemistry. . Second Edition.New York: John Wiley & Sons; 1991.
- Schreck DM, Brotea C, Shah S. Derivation of the 12-lead electrocardiogram using abstract factor analysis and simplex optimization. Int J Bioelectromagnetism 2002;4:337-8.
- Frank E. An accurate, clinically practical system for spatial vectorcardiography. Circulation 1956;13:737-49.
- Benchimol A. Vectorcardiography. Huntington, NY: Robert E. Krieger; 1979.
- Friedman H. Diagnostic and clinical electrocardiography and vectorcardiography. . Second Edition.New York: McGraw-Hill; 1977.
- Chou TC, Helm RA, Kaplan S. Clinical vectorcardiography. . Second Edition.New York: Grune & Stratton; 1974.
- Cooksey JD, Dunn M, Massie E. Clinical vectorcardiography and electrocardiog- raphy. . Second Edition.Chicago: Year Book Medical Publishers; 1977.
- Carson W. Emergency vectorcardiography. London: Wangdon Carson, MD; 1998.
- Orlando J, Aronow WS. Value of the vectorcardiogram in assessing tall R waves in Right precordial leads. Chest 1976;6:540-2.
- Chou TC. When is the vectorcardiogram superior to the scalar electrocardiogram? J Am Coll Cardiol 1986;8:791-9.
- Edenbrandt L, Pahlm O, Lyttkens K, et al. Vectorcardiogram more sensitive than 12-lead ECG in the detection of Inferior myocardial infarction. Clin Physiol 1990;10:551-9.
- Riera RAP, Uchida AH, Filho CF. Significance of vectorcardiogram in the cardiologic diagnosis of the 21st century. Clin Cardiol 2007;30:319-23.
- Schijvenaars BJA, van Herpen G, Kors JA. Intraindividual variability in electrocar- diograms. J Electrocardiol 2008;41:190-6.