Using Google Flu Trends data in forecasting influenza-like-illness related ED visits in Omaha, Nebraska
a b s t r a c t
Introduction: Emergency department (ED) visits increase during the influenza seasons. It is essential to identify statistically significant correlates in order to develop an accurate Forecasting model for ED visits. Forecasting influenza-like-illness (ILI)-related ED visits can significantly help in developing robust Resource management strategies at the EDs.
Methods: We first performed correlation analyses to understand temporal correlations between several predictors of ILI-related ED visits. We used the data available for Douglas County, the biggest county in Nebraska, for Omaha, the biggest city in the state, and for a major hospital in Omaha. The data set included total and positive influenza test results from the hospital (ie, Antigen rapid (Ag) and respiratory syncytial virus infection (RSV) tests); an Internet-based influenza surveillance system data, that is, Google Flu Trends, for both Nebraska and Omaha; total ED visits in Douglas County attributable to ILI; and ILI surveillance network data for Douglas County and Nebraska as the predictors and data for the hospital’s ILI-related ED visits as the dependent variable. We used Seasonal Autoregressive Integrated Moving Average and Holt Winters methods with3 linear regression models to forecast ILI-related ED visits at the hospital and evaluated model performances by comparing the root means square errors (RMSEs).
Results: Because of strong positive correlations with ILI-related ED visits between 2008 and 2012, we validated the use of Google Flu Trends data as a predictor in an ED influenza surveillance tool. Of the 5 forecasting models we have tested, linear regression models performed significantly better when Google Flu Trends data were included as a predictor. Regression models including Google Flu Trends data as a predictor variable have lower RMSE, and the lowest is achieved when all other variables are also included in the model in our forecasting experiments for the first 5 weeks of 2013 (with RMSE = 57.61).
Conclusions: Google Flu Trends data statistically improve the performance of predicting ILI-related ED visits in Douglas County, and this result can be generalized to other communities. Timely and accurate estimates of ED volume during the influenza season, as well as during pandemic outbreaks, can help hospitals plan their ED resources accordingly and lower their costs by optimizing supplies and staffing and can improve service quality by decreasing ED wait times and overcrowding.
(C) 2014 /p>
Introduction
Emergency department (ED) visits increase during the influenza season. Disease outbreaks, for example, pandemic influenza, can dramatically increase ED volumes. surveillance systems and early detection methods can help state and local health agencies, as well as hospitals, anticipate shifts in demand for health services and plan ahead in terms of logistics and staffing for response activities. Therefore, accurate and early forecasts of ED visits can play a critical
* Corresponding author. College of Public Health, University of Nebraska Medical Center, Omaha, NE 68198.
E-mail address: [email protected] (O.M. Araz).
role in emergency preparedness, and identifying predictors that can provide the most accurate statistical information for estimating influenza-like-illness (ILI)-related ED visits is an essential step in developing a useful forecasting tool. Influenza outbreaks can signifi- cantly affect ED overcrowding. In many EDs across the United States, a sudden increase in demand for services can cause extended wait times and overcrowding, which can decrease quality of care [1,2]. In 2009, an A/H1N1 influenza pandemic occurred worldwide and in the United States; this created an immediate increase in the demand for ED services that exceeded the capacity at many places in the country [3,4]. Forecasts of ILI-related visits to EDs may be used to improve resource use at the EDs, which may also lower hospital costs, optimize supplies and staffing, decrease wait times, and improve the quality of care provided to patients. On a daily basis, many EDs face substantial challenges when the
http://dx.doi.org/10.1016/j.ajem.2014.05.052
demand for treatment exceeds service capacity [5]. When these events arise, increased wait times result in overcrowding, and quality of service decreases [6-12]. Several factors can play a role in ED overcrowding, but an influenza outbreak may be a major factor. When an influenza pandemic hits major urban populations, patients with ILI symptoms flood into EDs and resulted in increased patient volumes in facilities that are most likely already operating at their maximum capacity [13].
In this article, we present statistical analyses of data from a major hospital in Omaha, Nebraska, related to ILI-related ED visits and data from state and county health departments, with an Internet-based influenza surveillance data, that is, Google Flu Trends (GFT) for Omaha and Nebraska. Data on predictor variables of ILI-related ED visits in this major hospital include GFT, Douglas County (where City of Omaha is located) ILI surveillance data, Douglas County ED visits data, and data on laboratory tests administered in the hospital for influenza. After the correlation analysis, we used these variables to develop forecasting models which may be used to assist hospitals and other health agencies in improving their resource use and quality of care while responding to disease outbreaks. This study statistically analyzes and assesses these potential predictors’ usefulness in forecasting ILI- related ED visits, and quantifies their relationships; it also evaluates various models for their performance in forecasting ILI-related ED visits in order to show the predictor power of the GFT data during seasonal influenza.
In the literature, GFT data have been used to forecast influenza Activity and its correlation with other influenza predictors is analyzed [14]. However, the present study uses GFT data for the first time, to the best of our knowledge, to forecast ED visits related to Influenza complications. We perform a statistical performance evaluation various forecasting models for their statistical accuracy in forecasting. Forecasting ILI-related ED visits can help both hospitals and public health agencies better prepare for influenza outbreaks, as ILI-related visits may account for 2% to 20% of total ED volume. Better preparation for influenza outbreaks can also improve budgeting, lower hospital costs, optimize supplies and staffing, decrease Waiting times, and ultimately improve the quality of care provided to patients. In the rest of the article, we first present a literature review on GFT used to forecast influenza-related activities and then explain methods and data used in the present study. Results are then presented, followed by a discussion and conclusions.
Literature review
health care systems bear an enormous Financial burden not only from pandemic influenza but also from seasonal influenza. As Afilialo et al [15] showed, the United States faces annual costs of more than
$5 billion as a result of 226000 seasonal influenza hospitalizations, with more than $12 billion in costs for pandemic influenza. One study conducted at the Children’s National Medical Center in Washington, DC, noted a significant (77.7%) increase in the number of ED patients with ILI-related symptoms during the 2009 A/H1N1 pandemic, compared with the same period in 2008 [16]. The same study also reported that during the 2009 A/H1N1 pandemic, nationwide volume of ED visits related to ILI was nearly double that of the same period prior to the pandemic time, which also had a huge impact on hospital resource use. In addition, the 2009 A/H1N1 influenza pandemic highlighted the need to ratify a forecasting model that can predict influenza outbreaks in real time and can be used as a decision support tool [17-20].
Virus strain can determine the characteristics of the pandemic with 2 parameters: transmissibility, that is, how quickly and easily the influenza virus spreads among human populations, and severity, that is, how virulent or deadly the virus strain is [21]. In the past, 2 major influenza A epidemics have posed a serious threat to the US health care system: the 1918 Spanish flu pandemic and the 2009 swine flu (H1N1/A) outbreak. Since the first pandemic in 1918,
which killed 40 to 50 million people worldwide [15], public health agencies have made significant efforts toward effective surveillance of infectious diseases [22]. However, an influenza pandemic is still a major Public health concern both for community health communi- ties and for social and economic life, and accurate estimates of these parameters may significantly help optimal decision making during pandemic emergencies.
real-time surveillance of an outbreak would alert health care providers and policy makers in the early phase, enabling them to better prepare staff and supplies [23,24]. Internet-based search data can be an important source for monitoring and forecasting influenza activity [25]. One recent data source that researchers have been further analyzing and incorporating into surveillance systems is GFT, a Web-based tool that aggregates data for various regions based on 45 ILI search engine inquiries [13,23,26,27]. Details about the search terms and queries can be found in Ginsberg et al [27]. For GFT to produce accurate estimates, a large population of Web search users is required; therefore, the use of GFT is better suited for developed countries and urban regions [23,28,29]. Dugas et al [13] presented a study using GFT that suggested high correlations with both the number of positive influenza test results and the number of patients presenting to the ED with ILI symptoms. They state that because GFT uses 45 ILI-related search queries to estimate the number of ILI-related provider visits data, in a given city or state, this system provides free and easily accessible data available online. The high correlations between GFT and ILI visits show potential value in predicting ILI- related ED visits, as reported by Ginsberg et al [27]. They also presented the validation of GFT data use with national ILI percentages providing information 7 to 10 days before the Centers for Disease Control and Prevention’s US influenza sentinel provider surveillance network. Although, very recently, there are contradictory reporting on the value of the GFT data in influenza surveillance [30,31], we believe that the accuracy on the predictive value of the data should be evaluated in the special cases of how they are used; for example, what other variables are used in the model and after statistical validations are convincingly performed. Then a decision should be made whether or not to use the GFT data in the predictive models.
Forecasting models can help hospitals be better prepared in terms
of staffing and supplies, which will improve budgeting and resource use. Forecasting daily attendance can be one way to help hospitals and EDs prepare for both seasonal and pandemic influenza [32]. In this article, we statistically evaluate the relation of ILI-related ED visits to other predictors of influenza activity to inform forecasting-based ED operational decision-making tools. We then use GFT as a predictor to forecast ED visits attributable to influenza complications. We quantify the value of using GFT data in forecasting by presenting performance evaluations of different forecasting models.
Methods
First, we performed correlation analyses to quantify correlations between various predictors of ILI-related ED visits and the ILI-related ED visits data in Nebraska and, for a major hospital, the Nebraska Medical Center (NMC). We performed these analyses to identify the best predictors of ILI-related ED visits and statistically evaluate whether GFT data can also provide valuable information about ED visits in a major urban area in Nebraska. After these analyses, to forecast the ILI-related ED visits, we used 5 different models: a Seasonal Autoregressive Integrated Moving Average (SARIMA) model, the Holt Winters exponential smoothing model, and 3 linear regression models (first, using all predictor variables; then with no test results data; and, finally, using only the GFT data as a predictor). Because ED Operational decisions are made weekly based on a review of the previous 2 weeks in the hospital, we performed our analysis based on weekly forecasts. Finally, we evaluated the accuracy of
these models using root means square error (RMSE) as a statistical performance measure.
Data
We used ILI surveillance network data from the Nebraska Department of Health and Human Services, ILI surveillance network data and laboratory test data from the Douglas County Health Department, GFT data for Omaha and for Nebraska; and laboratory test data and ED visit data from the NMC hospital, that is, 1 of the 2 trauma centers in the Omaha metropolitan area. Influenza-like-illness surveillance network data come from the providers in the network that reports the outpatient visits, hospitalizations, and mortality due to ILI, which is defined as fever of 100?F or higher, and cough and/or sore throat [33]. International Classification of Diseases, Ninth Edition codes were used in exporting these data from the relevant databases. GFT data are gathered based on 45 ILI-related Internet search inquiries [34] for the state of Nebraska and for Omaha. From the hospital database, we used influenza testing data with weekly total counts on positive cases for the influenza antigen test and also the total number of tests, total positive weekly counts of RSV tests, and total weekly RSV tests. We also used ED visit data from the Douglas County Health Department and ILI network data to forecast the NMC hospital’s ILI-related weekly ED visits. Figs. 1 and 2 show 2008 to 2012 data for Douglas
County ILI-related ED visits, Omaha GFT data, positive laboratory test result data for Douglas County, and ILI surveillance network data for Douglas County and Nebraska used in these analyses.
Google Flu Trends data are publicly available and use certain search terms that have been found to be good indicators of flu activity. Google Flu Trends uses aggregated Google search data to estimate current flu activity around the world in near real time
[34] and the accessibility of the data that is easy relative to other data sources and available in GFT Web site (https://www.google. org/flutrends/us/#US)almost always for near-real-time response planning. Previous studies tested the validity of GFT and have shown that GFT closely follows actual influenza activity. Google Flu Trends has also previously been used to predict ED influenza visits and crowding metrics [13]. Here in this article, after performing our correlation and lag analyses to determine which variables (or combination of variables) best predict NMC hospital’s ED visits, we ran forecasting models and performed a statistical evaluation of these models.
Models
SARIMA model
For the SARIMA, we used an ARIMA (1,1,1) (0,1,0) model with the specified parameters [35,36] for simulating the continuation of data
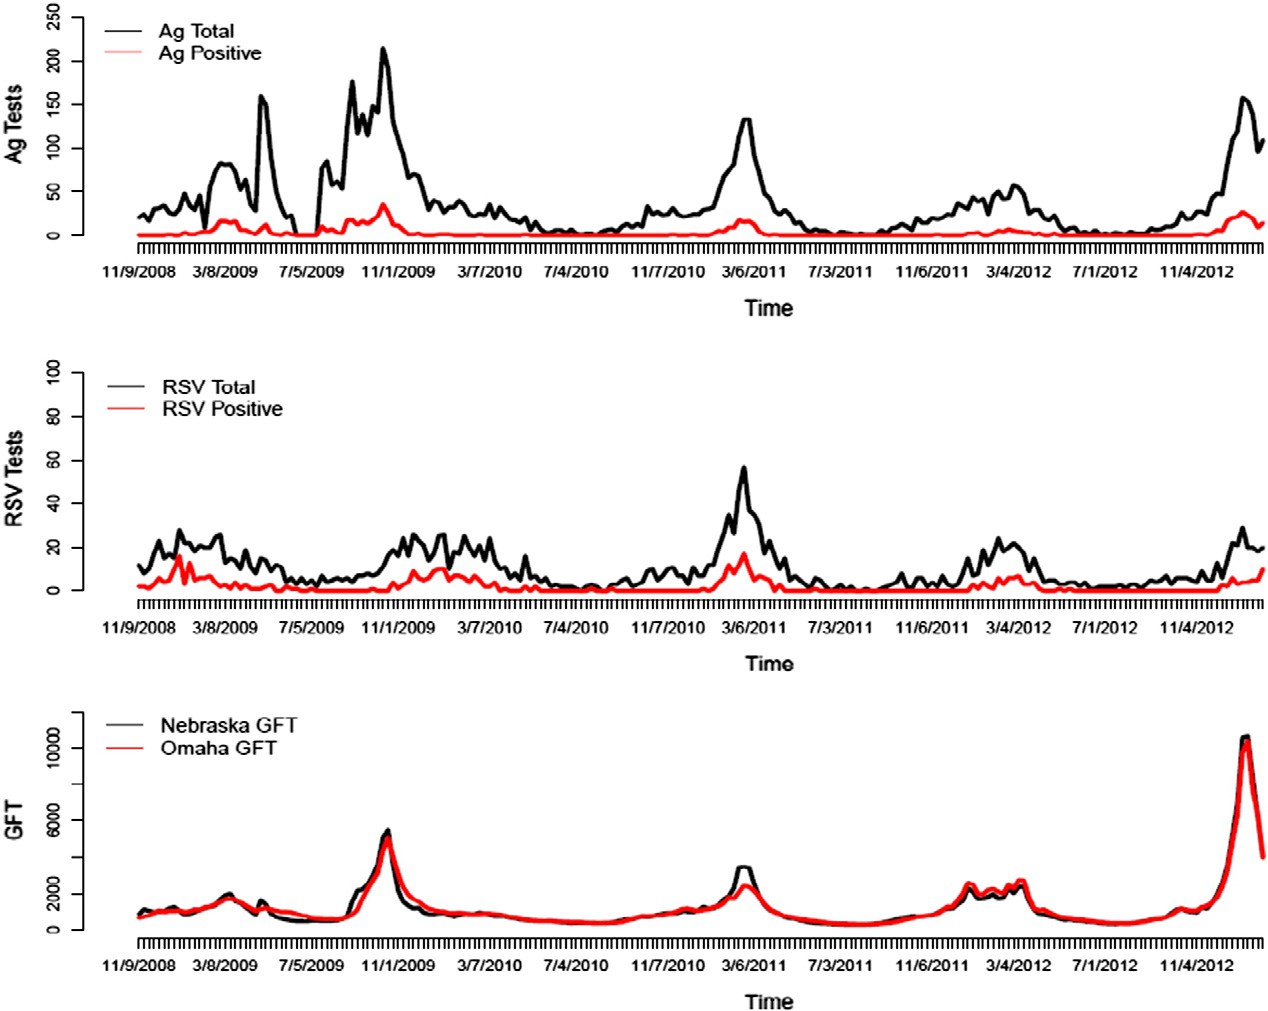
Fig. 1. Ag and RSV test data and Nebraska and Omaha GFT data, 2008 to 2012.
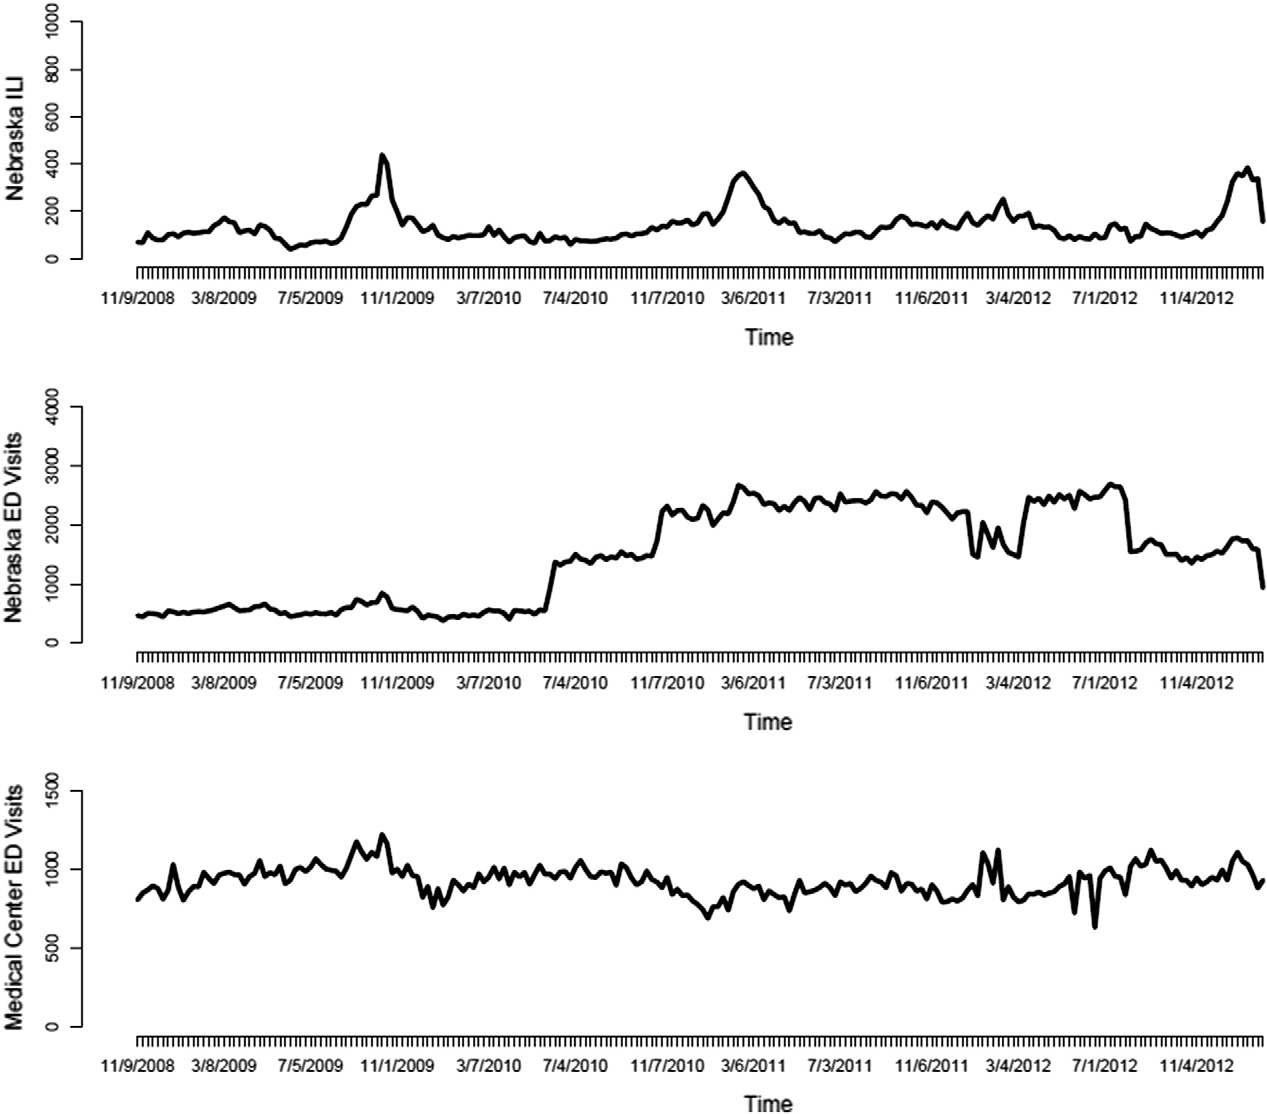
Fig. 2. Nebraska ILI surveillance and ED visits data and NMC ED visits data, 2008 to 2012.
for ILI-related ED visits. This simulation is performed for the first 6 weeks of 2013 for which the observed data exist, and the simulated data are also used for model performance evaluations.
Holt-Winters model
This exponential smoothing model is run with parameters of (0.45, 0, 0.86) for level, trend, and seasonal variation, respectively [35,37]. The forecasting is again performed for the same weeks in 2013.
Linear regression model 1
We run this model with the full data set, that is, including all variables, total influenza antigen testing (Antigen rapid (Ag) test) data (x1), positive Ag test data (x2), total Respiratory Syncytial Virus Infection (RSV) test data (x3), positive RSV test data (x4), Omaha GFT data (x5), Douglas County ED visits data (x6), and ILI Network data (x7), to forecast the NMC hospital ED visits (y). Because there is some time lag between the actual ED visits and GFT data (x5), Douglas County ED visits data (x6), and ILI Network data (x7), we include
these lags (?) in the regression model given in Eq. (1) with the error term (?), time indicator (t), and model coefficients (?).
yt = ?0 + ?1 x1t + ?2 x2t + ?3 x3t + ?4 x4t + ?5 x5t-? + ?6 x6t-?
+ ?7x7t-? + ? (1)
Linear regression model 2
The second regression model we tested used the predictor variables included in model 1, except Ag and RSV tests, as presented in Eq. (2).
yt = ?0 + ?5 x5t-? + ?6 x6t-? + ?7 x7t-? + ? (2)
Linear regression model 3
Finally, we ran this regression model with only GFT data, as presented in Eq. (3).
yt = ?0 + ?5x5t-? + ? (3)
Relation between ILI-related ED visits and other predictors for Douglas County ILI-related ED visits in relation to other predictors
|
Seasons |
Omaha GFT |
Nebraska GFT |
Douglas County positive Laboratory test results |
Douglas County ILI surveillance network data |
Nebraska ILI surveillance network data |
||
|
2008-2009 |
0.882 (0.89-0.96) |
0.919 (0.86-0.95) |
0.749 (0.60-0.84) |
0.819 (0.70-0.89) |
0.887 (0.81-0.93) |
||
|
2009-2010 |
0.901 (0.83-0.94) |
0.886 (0.81-0.933) |
0.781 (0.64-0.86) |
0.739 (0.58-0.84) |
0.738 (0.58-0.84) |
||
|
2010-2011 |
0.91 (0.84-0.94) |
0.917 (0.86-.95) |
0.894 (0.82-0.93) |
0.371 (0.11-0.58) |
0.827 (0.71-0.89) |
||
|
2011-2012 |
0.787 (0.54-0.86) |
0.78 (0.59-0.88) |
0.608 (0.33-0.78) |
0.304 (0.04-0.58) |
0.667 (0.42-0.82) |
||
|
2008-2012 |
0.841 (0.77-0.89) |
0.832 (0.78-0.87) |
0.658 (0.56-0.73) |
0.553 (0.44-0.64) |
0.782 (0.72-0.83) |
95% CIs are presented in parentheses.
Results and analyses
We present a correlation analysis in Table 1 for the following variables: ILI-related ED visits data, Omaha and Nebraska GFT data, Douglas County positive laboratory test results, Douglas County ILI surveillance data, and Nebraska ILI provider data. We report the pairwise correlations for 2008 to 2009, 2009 to 2010, 2010 to 2011,
2011 to 2012, and for 4 years, that is, 2008 to 2012, with 95% confidence interval (CI) in parentheses in Table 1. Cross-correlations between each variables are presented in Appendix A.
As it can be seen from Table 1, the GFT correlations were higher for both Omaha and Nebraska during the 2008 to 2012 period, that is, r = 0.841 for Omaha GFT and r = 0.832 for Nebraska GFT. Correlations during the 2011 to 2012 flu season were lower than those for previous seasons because the flu seasons since the 2009 pandemic have been relatively mild, because the same flu strain from the previous season was circulating, and because the populations of interest were highly immunized.
Because we are aware of the significant time delays in county health systems’ reporting of ILI-related data, the results presented in Table 1 are not surprising. Therefore, we performed analyses on correlation relations of lagged variables with data on Douglas County ILI-related ED visits to quantify these delays and find the optimum lag or lead time for the variables to be used in forecasting ILI-related ED visits. As presented earlier, Nebraska GFT data were one of the predictors with the highest correlation value at 0 lag; however, higher correlations with ILI- related ED visit data were achieved with a 1-week lead (ie, r = 0.860) for the same variable. Similarly, with a 1 week of lag for the Douglas County ILI surveillance network data, a higher correlation was obtained, (ie, r = 0.607). Interestingly, GFT data for Nebraska perform well statistically as a predictor of ILI-related ED visits in Douglas County;
however, because of the population differences between the state and the county, we still observe a 1-week lead. On the other hand, Omaha GFT data also perform well, but it is a timely well-synchronized predictor for ILI-related ED visits in Douglas County.
Forecasting results
Here we present the forecasting results for the first 5 weeks in 2013 for which the observed data are available, by using the previously described models. Using the SARIMA model, we forecasted the complete 2013 ILI-related ED visits as a simulation of the continuation of the times series. Different replications of the continuation of the time series (ie, weekly ED visits from 2009 to end of 2012) are simulated with SARIMA model, and in Fig. 3, the red line presents the average of these replications, whereas the dashed black line represents the forecasts obtained with Holtz Winter exponential smoothing model for the same period.
These 2 models used only the weekly ILI-related ED visits data to forecast future ILI-related visits. However, previous studies have shown that other predictors of influenza activity can also be used for estimating ILI-related ED visits, and therefore, as explained before, we used Ag and RSV test results, ILI surveillance data, and GFT data to forecast ED visits attributable to ILI at the NMC hospital. We ran 3 different linear regression models to quantify the value of the GFT data in forecasting ILI-related ED visits. We first used all the variables in the linear regression, then excluded the test results data, and finally used only the GFT data. Figs. 4, 5, and 6 show the results for the first 5 weeks in 2013 for which we had the observed data; we used these actual values in the performance evaluation of all the models developed in this study.

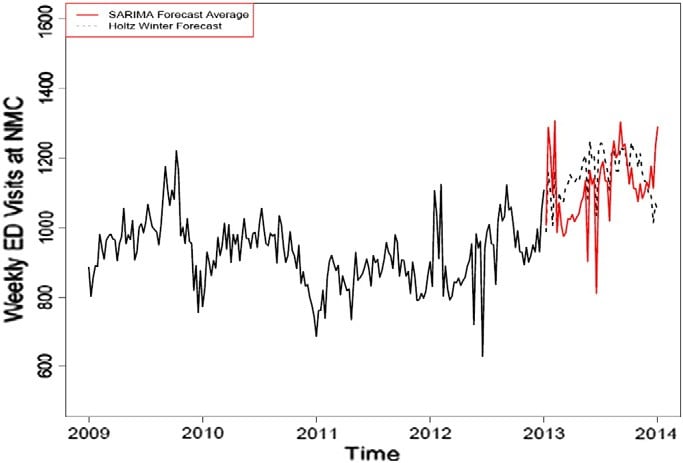 Fig. 3. Holtz Winter model results.
Fig. 4. Linear regression-based forecasting results with full data set (blue line shows the forecasted values, dark gray area shows the 80% CI of the forecasts, and light gray area shows the 95% CI of the forecasts).
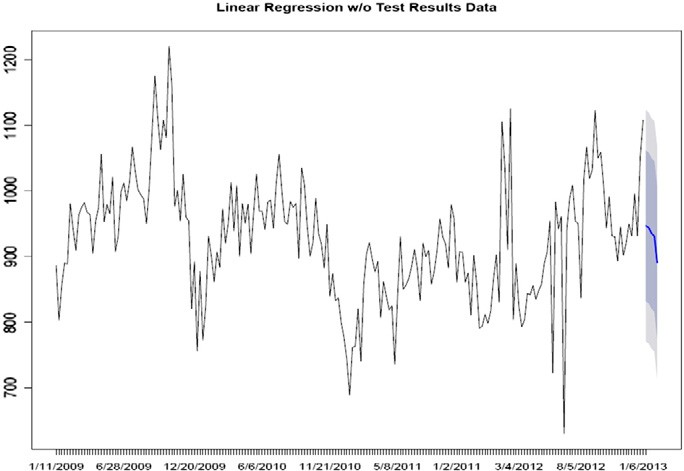
Fig. 5. Linear regression-based forecasting results without the Ag and RSV test data (blue line shows the forecasted values, dark gray area shows the 80% CI of the forecasts, and light gray area shows the 95% CI of the forecasts).
Finally, we evaluated the performance of each model by using the observed data during the first 5 weeks of 2013. We used RMSE to compare model performance. Although other performance measures can be used for statistical evaluations, RSME has been shown to be one of the most effective, especially in forecasting ILI-related activities. A regression model constructed with the full data set used as the predictors of ILI-related ED visits performed better than other models (ie, RMSE = 57.61; Table 2). In addition, GFT data alone also performed well (second best), with an RMSE of 66.99. Although there is no absolute criterion for a good RMSE value, the forecasts deviate from the observed values, with 2% to 8% and 1% to 10% ranges in the full linear regression and the GFT-only linear regression models, respectively.
Conclusions
Forecasting ED visits and planning resources and surge capacity accordingly not only can reduce the operating costs of EDs but also may significantly affect the clinical outcomes. Therefore, evaluation of investigating on influenza surveillance systems and predictive models should take into account these indirect effects as well. Internet-based influenza surveillance system data can easily be exported from the
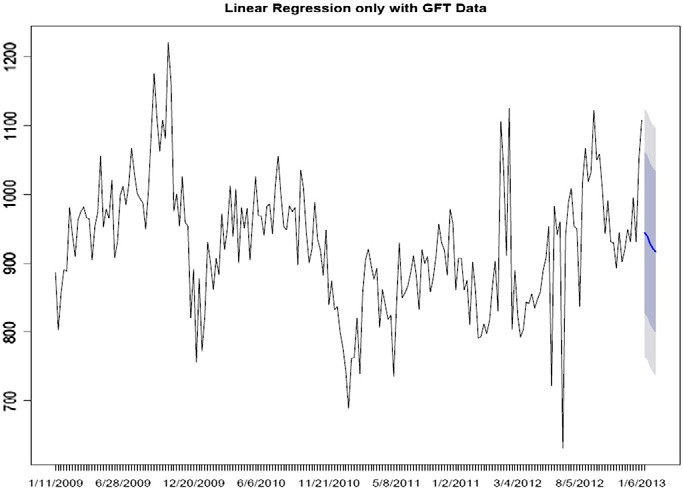
Fig. 6. Linear regression-based forecasting results using only GFT data as the predictor variable (blue line shows the forecasted values, dark gray area shows the 80% CI of the forecasts, and light gray area shows the 95% CI of the forecasts).
Table 2
Performance evaluation of the forecasting models using RMSE
|
Weeks |
Observed 2013 ILI- related ED visits data |
Holt Winters model |
SARIMA model |
Linear regression (Full) |
Linear regression (without test results data) |
Linear regression (with only GFT data) |
|
1 |
1050 |
987.63 |
1007 |
964.08 |
946.85 |
944.75 |
|
2 |
1030 |
1157.51 |
1288 |
955.01 |
943.75 |
939.50 |
|
3 |
965 |
1004.95 |
1218 |
935.64 |
935.27 |
928.06 |
|
4 |
881 |
1163 |
1092 |
925.83 |
930.93 |
921.38 |
|
5 |
930 |
988.08 |
1306 |
909.02 |
981.06 |
916.61 |
|
RMSE |
147.09 |
248.85 |
57.61 |
67.78 |
66.99 |
Web and used in predictive models for informing operational decision at EDs. This study show that GFT can perform statistically well as a predictor of ILI-related ED visits for a major hospital in Omaha, Nebraska. Although there are recent discussions and analyses in the literature about the accuracy of this data source, researchers and models should keep in mind the likelihood of overestimation that maybe caused with GFT data being used in the models and design their systems to include as many predictors as possible to provide the best information available after a through statistical analysis in specific cases.
The conclusion that we made above, not surprisingly, can be expected for other communities as well. Our results show that using other predictor variables can significantly improve the forecasting power of statistical models, but a lag analysis should be also performed in order to determine time differences in the emergence of data before using in a model. Simulation of the continuation of the time series for the ILI-related ED visit data via SARIMA or Holt Winters models did not provide statistically accurate estimates due to nonlinearity and seasonality of the data. However, GFT-based regression models can generate better results. Influenza-like-illness provider network data can also be a useful predictor of ILI-related ED visits; however, time lags should be taken into account to fully use the information this data source can provide. The strong positive correlations between ILI- related ED visits and GFT data in 2008 to 2012, as presented in this study, show that the use of GFT data can greatly improve statistical forecasting and surveillance of ILI-related ED visits.
The next step to this study will include integrating the best forecasting model with decision optimization tools to develop a decision support system for hospital EDs. Timely and accurate estimates of ED volume during the influenza seasons, as well as during pandemic outbreaks, can help hospitals optimize their supplies and staffing in the ED, which ultimately will help in lowering their operational costs and improving quality of service and clinical outcomes by decreasing ED wait times and overcrowding.
Acknowledgments
We would like to thank Bonnie Harmon, RN, MSN, and Anne O’Keefe, MD, of Douglas County Health Department; Tim Timmons, RN, of Lancaster County Health Department; and, finally, Robin Williams of the Nebraska Division of Public Health for providing us the data that we used in this study and also for their invaluable input on our analyses.
References
- Silka PA, Geiderman JM, Goldberg JB, Kim LP. Demand on ED resources during periods of widespread influenza activity. Am J Emerg Med 2003;21(7):534-9.
- Sikka R, Mehta S, Kaucky C, Kulstad EB. ED crowding is associated with an increased time to pneumonia treatment. Am J Emerg Med 2010;28(7):809-12.
- McDonnell W, Nelson DS, Schunk JE. Should we fear “flu fear” itself? Effects of H1N1 influenza fear on ED use. Am J Emerg Med 2012;30:275-82.
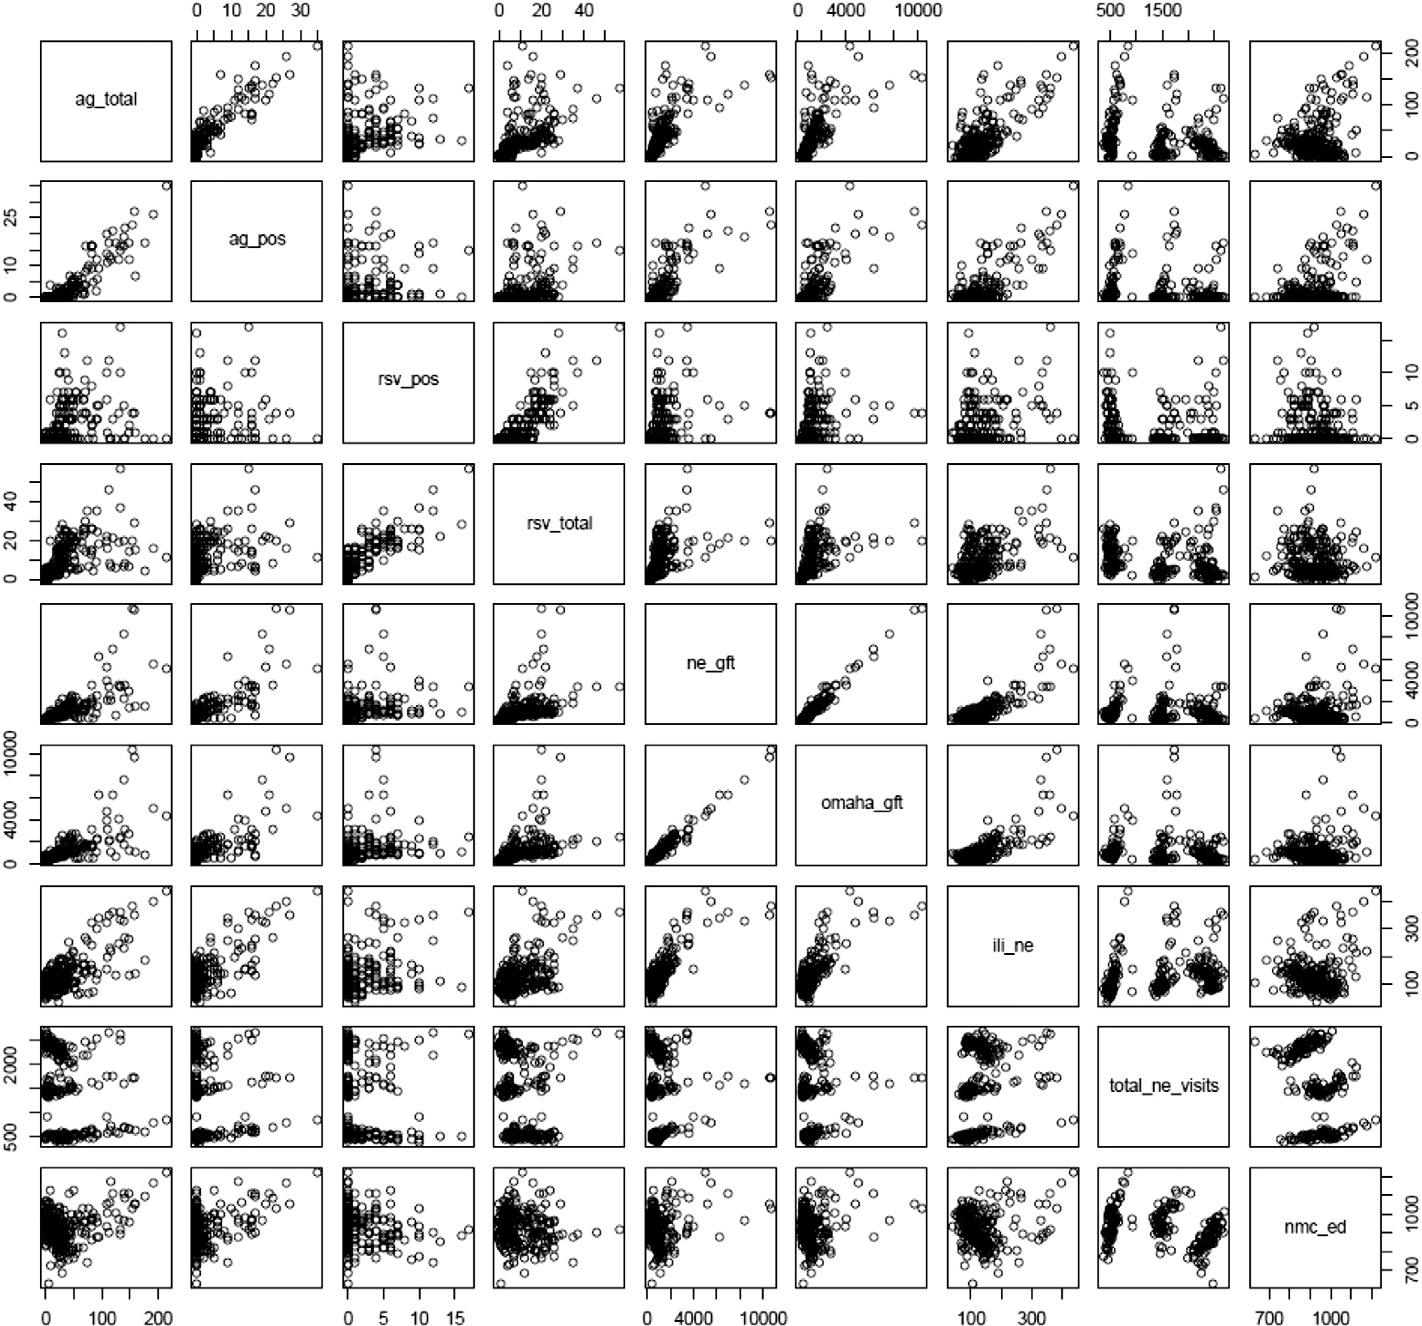
Appendix A Cross-correlation scatter diagram for the variables used in the analyses.
Self WH, Grijalva CG, Zhu Y, Talbot HK, Jules A, Widmer KE, et al. Emergency department visits for influenza A (h1N1) pdm09, Davidson County Tennessee, USA. Emerging Infectious Diseases 2012;18(5):863-5.
- McCarthy ML, Aronsky D, Kelen GD. The measurement of daily surge and its relevance to Disaster preparedness. Acad Emerg Med 2006;13(11):1138-41.
- Schull MJ. Urban emergency department overcrowding: defining the problem and eliminating misconceptions. EM Adv 2001;4(2):76-93.
- Epstein SK, Huckins DS, Liu SW, Pallin DJ, Sullivan AF, Lipton RI, et al. Emergency department crowding and risk of preventable Medical errors. Intern Emerg Med 2012;7(2):173-80.
- Fayyaz J, Khursheed M, Mir MU, Mehmood A. Missing the boat: odds for the patients who leave ED without being seen. BMC Emerg Med 2013;13(1):1-9.
- Fee C, Weber EJ, Maak CA, Bacchetti P. Effect of emergency department crowding on time to antibiotics in patients admitted with community-acquired pneumonia. Ann Emerg Med 2007;50(5):501-9 [509.e1].
- Gravel J, Gouin S, Carriere B, Gaucher N, Bailey B. Unfavourable outcome for children leaving the emergency department without being seen by a physician. CJEM 2013;15:1-11.
- McCarthy ML, Zeger SL, Ding R, Levin SR, Desmond JS, Lee J, et al. Crowding delays treatment and lengthens emergency department length of stay, even among high- acuity patients. Ann Emerg Med 2009;54(4):492-503.e4.
- Vieth TL, Rhodes KV. The effect of crowding on access and quality in an academic ED. Am J Emerg Med 2006;24(7):787-94.
- Dugas AF, Hsieh Y, Levin S, Pines JM, Mareiniss DP, Mohareb A, et al. Google flu trends: correlation with emergency department influenza rates and crowding metrics. Clin Infect Dis 2012;54(4):463-9.
- Dugas AF, Jalalpour M, Gel Y, Levin S, Tocaso F, Igusa T, et al. Influenza forecasting with Google Flu Trends. PLOS ONE 2013;8(2):e56176. http://dx.doi.org/10.1371/journal. pone.0056176.
- Afilialo M, Oughton M, Stern E. Evaluation and management of seasonal influenza in the emergency department. Emerg Med Clin A 2012;30:271-305.
- Song X, DeBiasi RL, Campos JM, Fagbuyi DB, Jacobs BR, Singh N. Comparison of pandemic and seasonal influenza: infections in pediatric patients: were they different? Influenza Other Respir Viruses 2012;6(1):25-7.
- Boyle JR, Sparks RS, Keijzers BB, Crilly J, Lind JF, Ryan LM. Prediction and surveillance of influenza epidemics. Med J Aust 2011;194(4):S28-32.
- Kass-Hout TA, Mc Murray P, Park S, Buckeridge DL, Brownstein JS, Finelli L, et al. Application of change point analysis to daily influenza-like illness emergency department visits. J Am Med Inform Assoc 2012;19:1075-81.
- Sugerman D, Nadeau KH, Lafond K, Cameron W, Soetebier K, Jhung M, et al. A survey of emergency department 2009 pandemic influenza A (H1N1) surge preparedness- Atlanta, Georgia, July-October 2009. Clin Infect Dis 2011;52(Suppl 1):S177-82.
- Waseem M, Mcinerney JE, Perales O, Leber M. Impact of operational staging to improve Patient throughput in an inner-city emergency department during the novel H1N1 influenza surge: a descriptive study. Pediatr Emerg Care 2012;28 (1):39-42.
- Araz OM, Damien P, Paltiel DA, Burke S, Geijn BV, Galvani A, et al. Simulating school closure policies for cost effective pandemic decision making. BMC Publ Health 2012;12:449 [1-11] http://dx.doi.org/10.1186/1471-2458-12-449.
- Scarpino SV, Dimitrov N, Meyers LA. Optimizing provider recruitment for influenza surveillance networks. PLoS Comput Biol 2012;8(4):e1002472 [1-12].
- Carneiro HA, Mylonakis E. Google Trends: a Web-based tool for real-time surveillance of disease outbreaks. Clin Infect Dis 2009;49:1557-64.
- Hall HM, Gani R, Hughes HE, Leach S. Real time epidemic forecasting for pandemic influenza. Epidemiol Infect 2007;135:372-85.
- Polgreen PM, Chen Y, Pennock DM, Nelson FD. Using Internet searches for influenza surveillance. Clin Infect Dis 2008;47:1443-8.
- Kang M, Zhong H, He J, Rutherford S, Yang F. Using Google Trends for influenza surveillance in South China. Plos One 2013;8(1):e55205 [1-6], http://dx.doi.org/ 10.1371/journal.pone.0055205.
- Ginsberg J, Mohebbi MH, Patel RS, Brammer L, Smolinski MS, Brilliant L. Detecting influenza epidemics using search engine query data. Nature 2009;457(7232):1012-4.
- Wilson N, Mason K, Tobias M, Peacey M, Huang QS, Baker M. Interpreting “Google Flu Trends” data for pandemic H1N1 influenza: the New Zealand experience. Euro Surveill 2009;14(44) [pii=19386, 1-3. Available online: http://www.eurosurveillance.org/ ViewArticle.aspx?ArticleId=19386].
- Shaman J, Karspeck A. Forecasting seasonal outbreaks of influenza. Proc Natl Acad Sci U S A 2012;109(50):20425-30.
- Lazer D, Kennedy R, King G, Vespignani A. The parable of Google Flu: traps in big data analysis. Science 2014;343(6176):1203-5.
- Butler B. When Google got flu wrong. Nature 2013;494(7436):155-6.
- Yan Sun, Heng BH, Seow YT, Seow E. Forecasting daily attendances at an emergency department to aid resource planning. BMC Emerg Med 2009;9(1):1-9.
- CDC (Centers for Disease Control, Prevention). http://www.cdc.gov/flu/weekly . [Accessed in Jan 2014].
- Google. Google Flu Trends. Available at: http://www.google.org/flutrends/us/#US. [Accessed June 2013].
- Hyndman RJ. fma: Data sets from forecasting: methods and applications by Makridakis, Wheelwright & Hyndman (1998). R package version 2.00; 2009.
- Sak H, Hormann W. Simulating the continuation of a time series in R; 2012 [arXiv:1212.2393v1 (stat.CO)].
- Cryer JD, Chan K-S. Time series analysis: with applications in R. 2nd ed. New York: Springer Science+Business Media, LLC; 2008.